CUDA Micro-benchmarks in Practice (Part 2): Peak Compute, Memory Bandwidth, and Hopper Asynchronous Pipelines
In the previous article, we explored the CUDA compilation toolchain, Warp scheduling mechanisms, and how to use Nsight Compute for performance bottleneck analysis.
Rather than listing isolated CUDA facts, this article revolves around one question: How do we design a trustworthy GPU micro-benchmark whose result explains real hardware behavior?
We will move from measurement methodology to compute throughput, memory bandwidth, memory ordering, and Inline PTX, then use Hopper WGMMA and TMA to show how computation and data movement form an asynchronous pipeline.
1. Establish a Trustworthy Measurement Protocol
Micro-benchmarks are usually short, but short code does not imply reliable results. GPU Boost, cache hits, compiler elimination, first-launch overhead, and timing scope can all change the number.
1.1 What Are We Measuring?
The same instruction can expose two different metrics:
- Latency: cycles from the input to the output of one dependency chain.
- Throughput: independent instructions completed per cycle after the pipeline reaches steady state.
A latency benchmark creates a dependency from one iteration to the next. A throughput benchmark uses multiple independent accumulators. Mixing the two is a common reason why a kernel reaches only a fraction of advertised throughput.
Bandwidth also needs a byte-counting convention. A device-to-device copy reads and writes $N$ bytes, so a common effective-bandwidth definition is:
$$ B_{\text{eff}}=\frac{N_{\text{read}}+N_{\text{write}}}{t} =\frac{2N}{t} $$Always state whether a reported value uses one-way bytes $N/t$ or aggregate read-plus-write bytes $2N/t$.
1.2 Control the Environment
Record at least:
- GPU model, driver, CUDA Toolkit, and compiler flags;
- observed SM/memory clocks, power limit, temperature, and ECC state;
- grid/block configuration, registers, shared memory, and occupancy;
- input size, data type, alignment, and iteration count.
Warm up before timing so context initialization, JIT, and cold-start effects are excluded. Repeat the experiment and report at least the median. If the goal is the hardware ceiling, the minimum may be reported as well, but never cherry-pick a single run.
For DRAM bandwidth, the working set must be substantially larger than L2. A cache benchmark should do the opposite: sweep the working-set size and observe transition points.
1.3 Prevent Dead-Code Elimination
Write results back to global memory and validate them on the host. Otherwise, the compiler may remove the entire loop.
Inspect both PTX and SASS:
|
|
Writing fmaf(), a vector type, or inline PTX does not guarantee the expected machine instruction. A micro-benchmark measures executed SASS, not source-code intent.
2. Compute Throughput: Feeding the ALUs
2.1 Theoretical and Measured Peak
A theoretical peak for one operation class can be summarized as:
$$ P_{\text{theory}}= N_{\text{unit}}\times \text{ops/cycle/unit}\times f_{\text{clock}} $$Execution-unit count, per-cycle throughput, and available pipelines depend on architecture and data type. Use the observed clock during the benchmark rather than blindly substituting a marketing Boost Clock.
An FMA counts as 2 FLOPs. If every thread has $A$ independent accumulators, executes $I$ iterations, and the launch has $T$ threads:
$$ P_{\text{measured}}=\frac{2AIT}{t} $$$t$ should cover only the steady compute region.
2.2 Independent Accumulators and Dependency Chains
A throughput kernel has this basic shape:
|
|
The four FMA chains are independent. While one chain waits for its result, the scheduler can issue another. Too few chains expose RAW latency; too many increase register pressure and may reduce occupancy. Sweep accumulator count instead of assuming that more unrolling is always better.
A latency kernel should keep only one dependency chain and divide total cycles by iteration count. Throughput and latency require different kernels.
FP16x2 processes two half elements per instruction, but twice the element throughput does not mean half the latency. Packing, conversion, and architecture-specific pipelines still matter.
3. Memory Bandwidth: Fewer Instructions Do Not Mean Fewer Transactions
3.1 Coalescing, Alignment, and Continuity
A warp memory request may be split into multiple sectors or transactions according to its addresses. The exact granularity and cache path are architecture-dependent; “128 contiguous bytes” should not be equated with “always one transaction.”
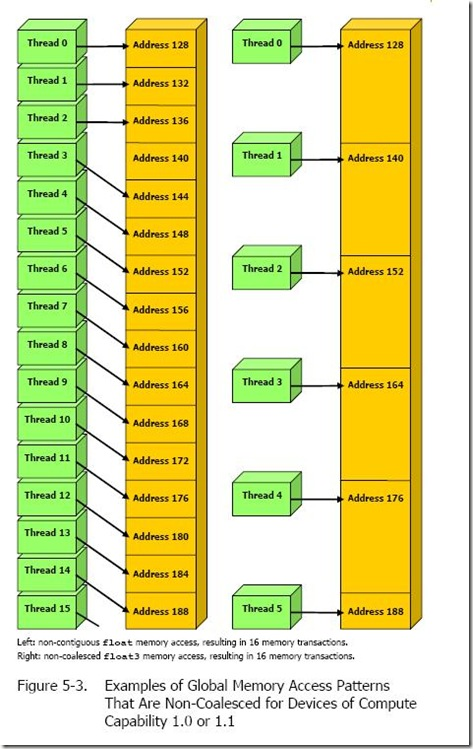
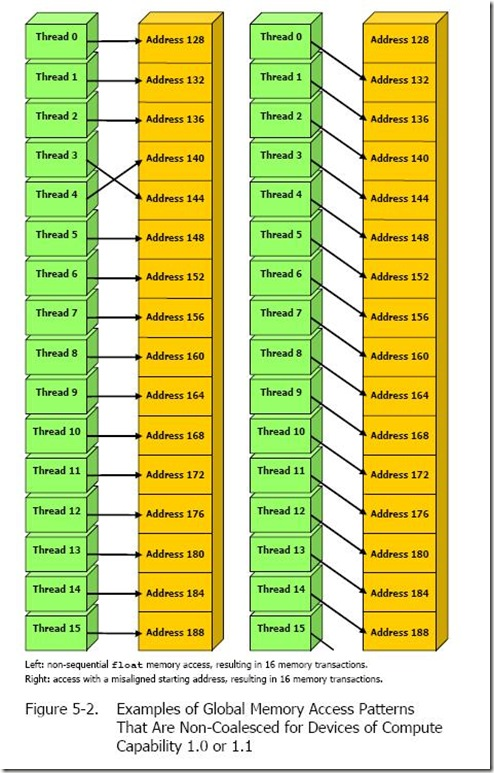
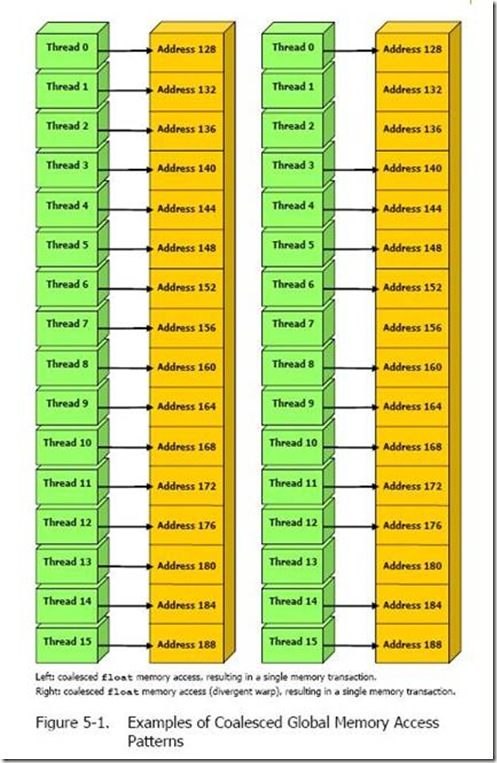
The figures show three distinct problems:
- Uncoalesced access: lane requests cannot be covered by a small number of contiguous sectors.
- Unaligned access: a request crosses sector or cache-line boundaries.
- Discontinuous access: stride expands the covered address range, and much of the transferred data is unused.
Use Nsight Compute sector counts, request counts, and DRAM bytes rather than inferring efficiency only from C++ indices.
3.2 What Vectorized Access Actually Does
Types such as int2, int4, and float4 let one thread move more bytes with fewer load/store instructions:
|
|
This can reduce instruction-issue pressure, but it does not automatically fix unaligned or uncoalesced access. Pointers must satisfy vector alignment, and accesses across a warp still need to be contiguous.
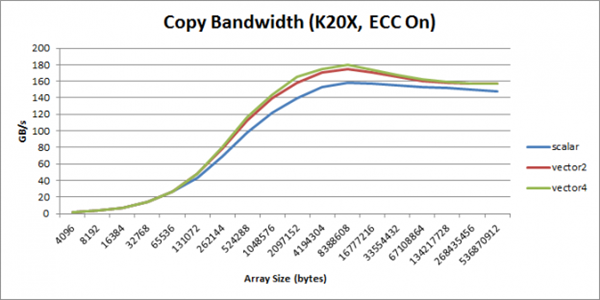
The curves are similar for small working sets because fixed overhead and caches dominate. For larger working sets, vector2/vector4 may gain bandwidth by reducing instruction count. This result is from K20X and should not be extrapolated directly to Hopper.
A complete bandwidth benchmark should:
- use arrays larger than L2;
- warm up before timing;
- avoid special cache/compiler paths by varying data;
- report instruction count and DRAM bytes for scalar/vectorized variants;
- validate output.
4. Memory Ordering: Benchmark a Correct Program
A fast concurrent benchmark with a data race is meaningless. Distinguish:
- Compiler barrier: limits compiler reordering.
- Memory fence: orders observed memory operations.
- Barrier: makes participating threads rendezvous.
- Visibility: determines whether another thread can observe data through the correct cache/atomic path.
A fence is not thread synchronization and does not by itself guarantee visibility. CUDA’s partial-sum pattern combines an observable result store, a device-scope fence, an atomic counter, and synchronization.
|
|
Without the fence, another thread may observe the count update before the result store is properly published. A fence alone is still insufficient: the consumer needs a correct atomic/synchronization protocol.
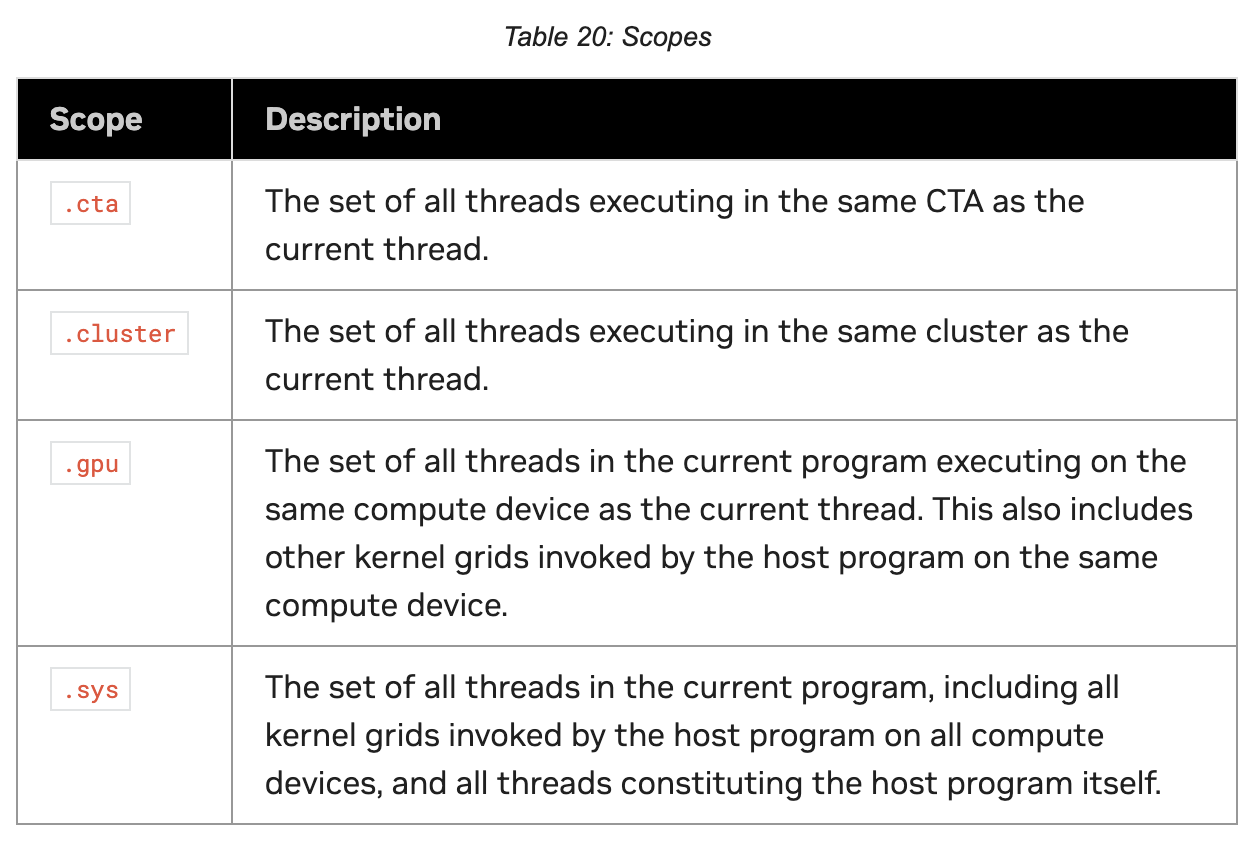
Release/Acquire semantics express publication and consumption more precisely. Scope identifies participants, commonly block, cluster, device, or system. Production code should prefer cuda::atomic / cuda::atomic_ref memory orders and thread scopes where possible.
Hopper TMA and WGMMA also introduce the async proxy. Normal loads/stores use the generic proxy, while TMA and some asynchronous matrix operations use an async proxy. Data handoff across proxies requires the corresponding proxy-fence or barrier protocol.
5. Inline PTX: Control Measurement Boundaries, Then Verify
5.1 Reading Timers
Read an SM-local cycle counter:
|
|
PTX special registers need %%clock inside an inline-asm string. %clock / clock64() are suitable for short dependency chains on one SM. %globaltimer can compare timestamps across SMs, but its read overhead should still be calibrated.


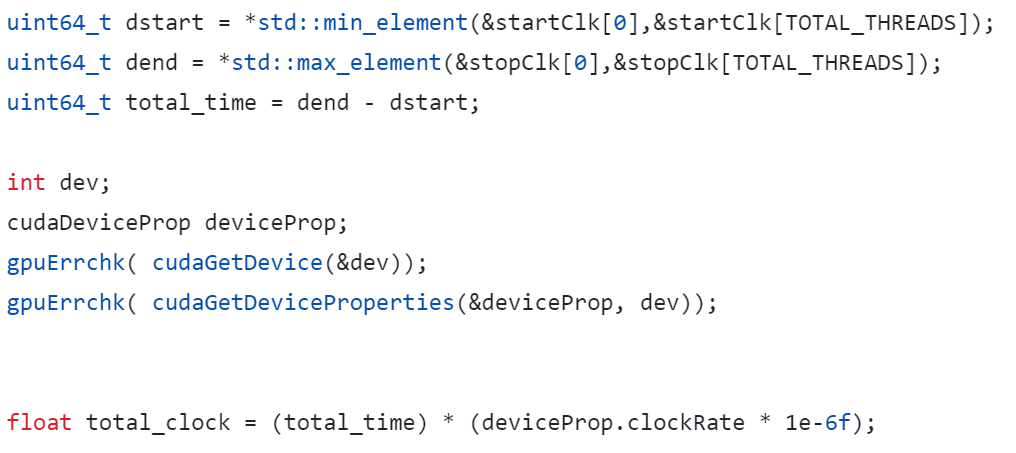
CUDA Events are usually better for whole kernels; thread-local timers are useful for isolating short instruction sequences.
5.2 volatile and the "memory" Clobber
The compiler assumes asm() has no side effects beyond output operands. Use volatile when the instruction must not be removed or moved:
|
|
If asm implicitly reads or writes user memory through a pointer, or memory optimization around asm must be blocked:
|
|
"memory" is a compiler-level clobber. It does not emit a GPU memory fence or replace thread synchronization.

5.3 Operand Constraints
= means a write-only output, while + means a read-write operand:
|
|
If PTX reads the original operand value, use + or separate input/output operands. This is not about preventing reuse of a physical register by unrelated instructions.
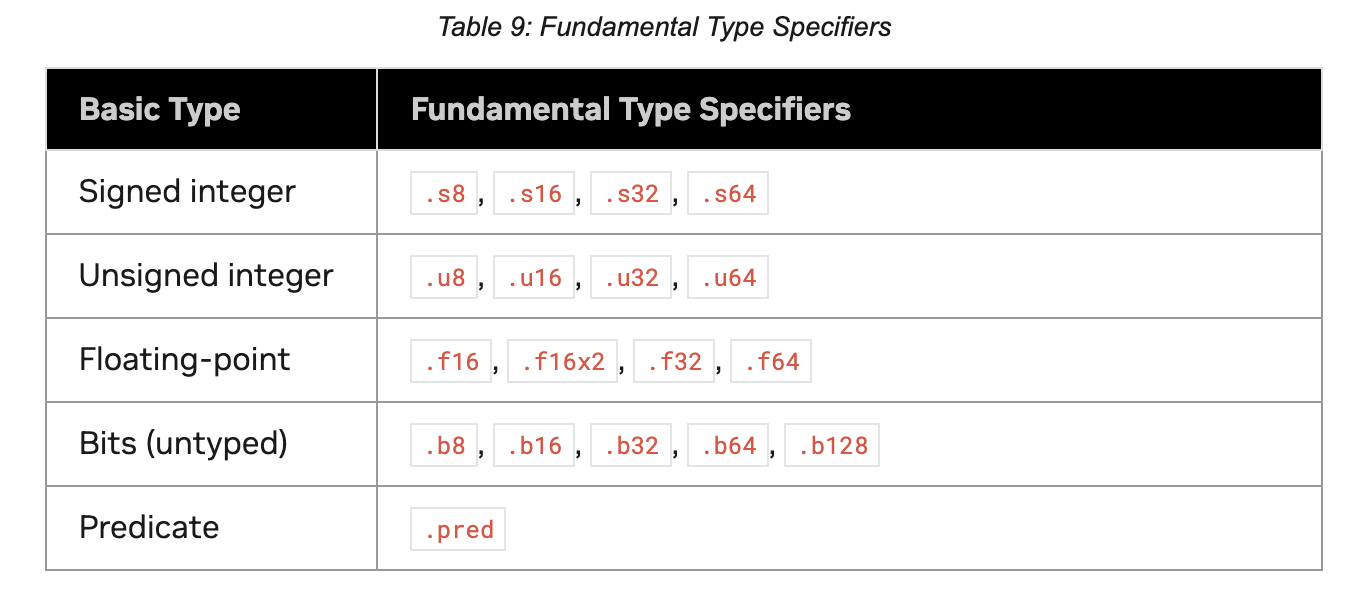
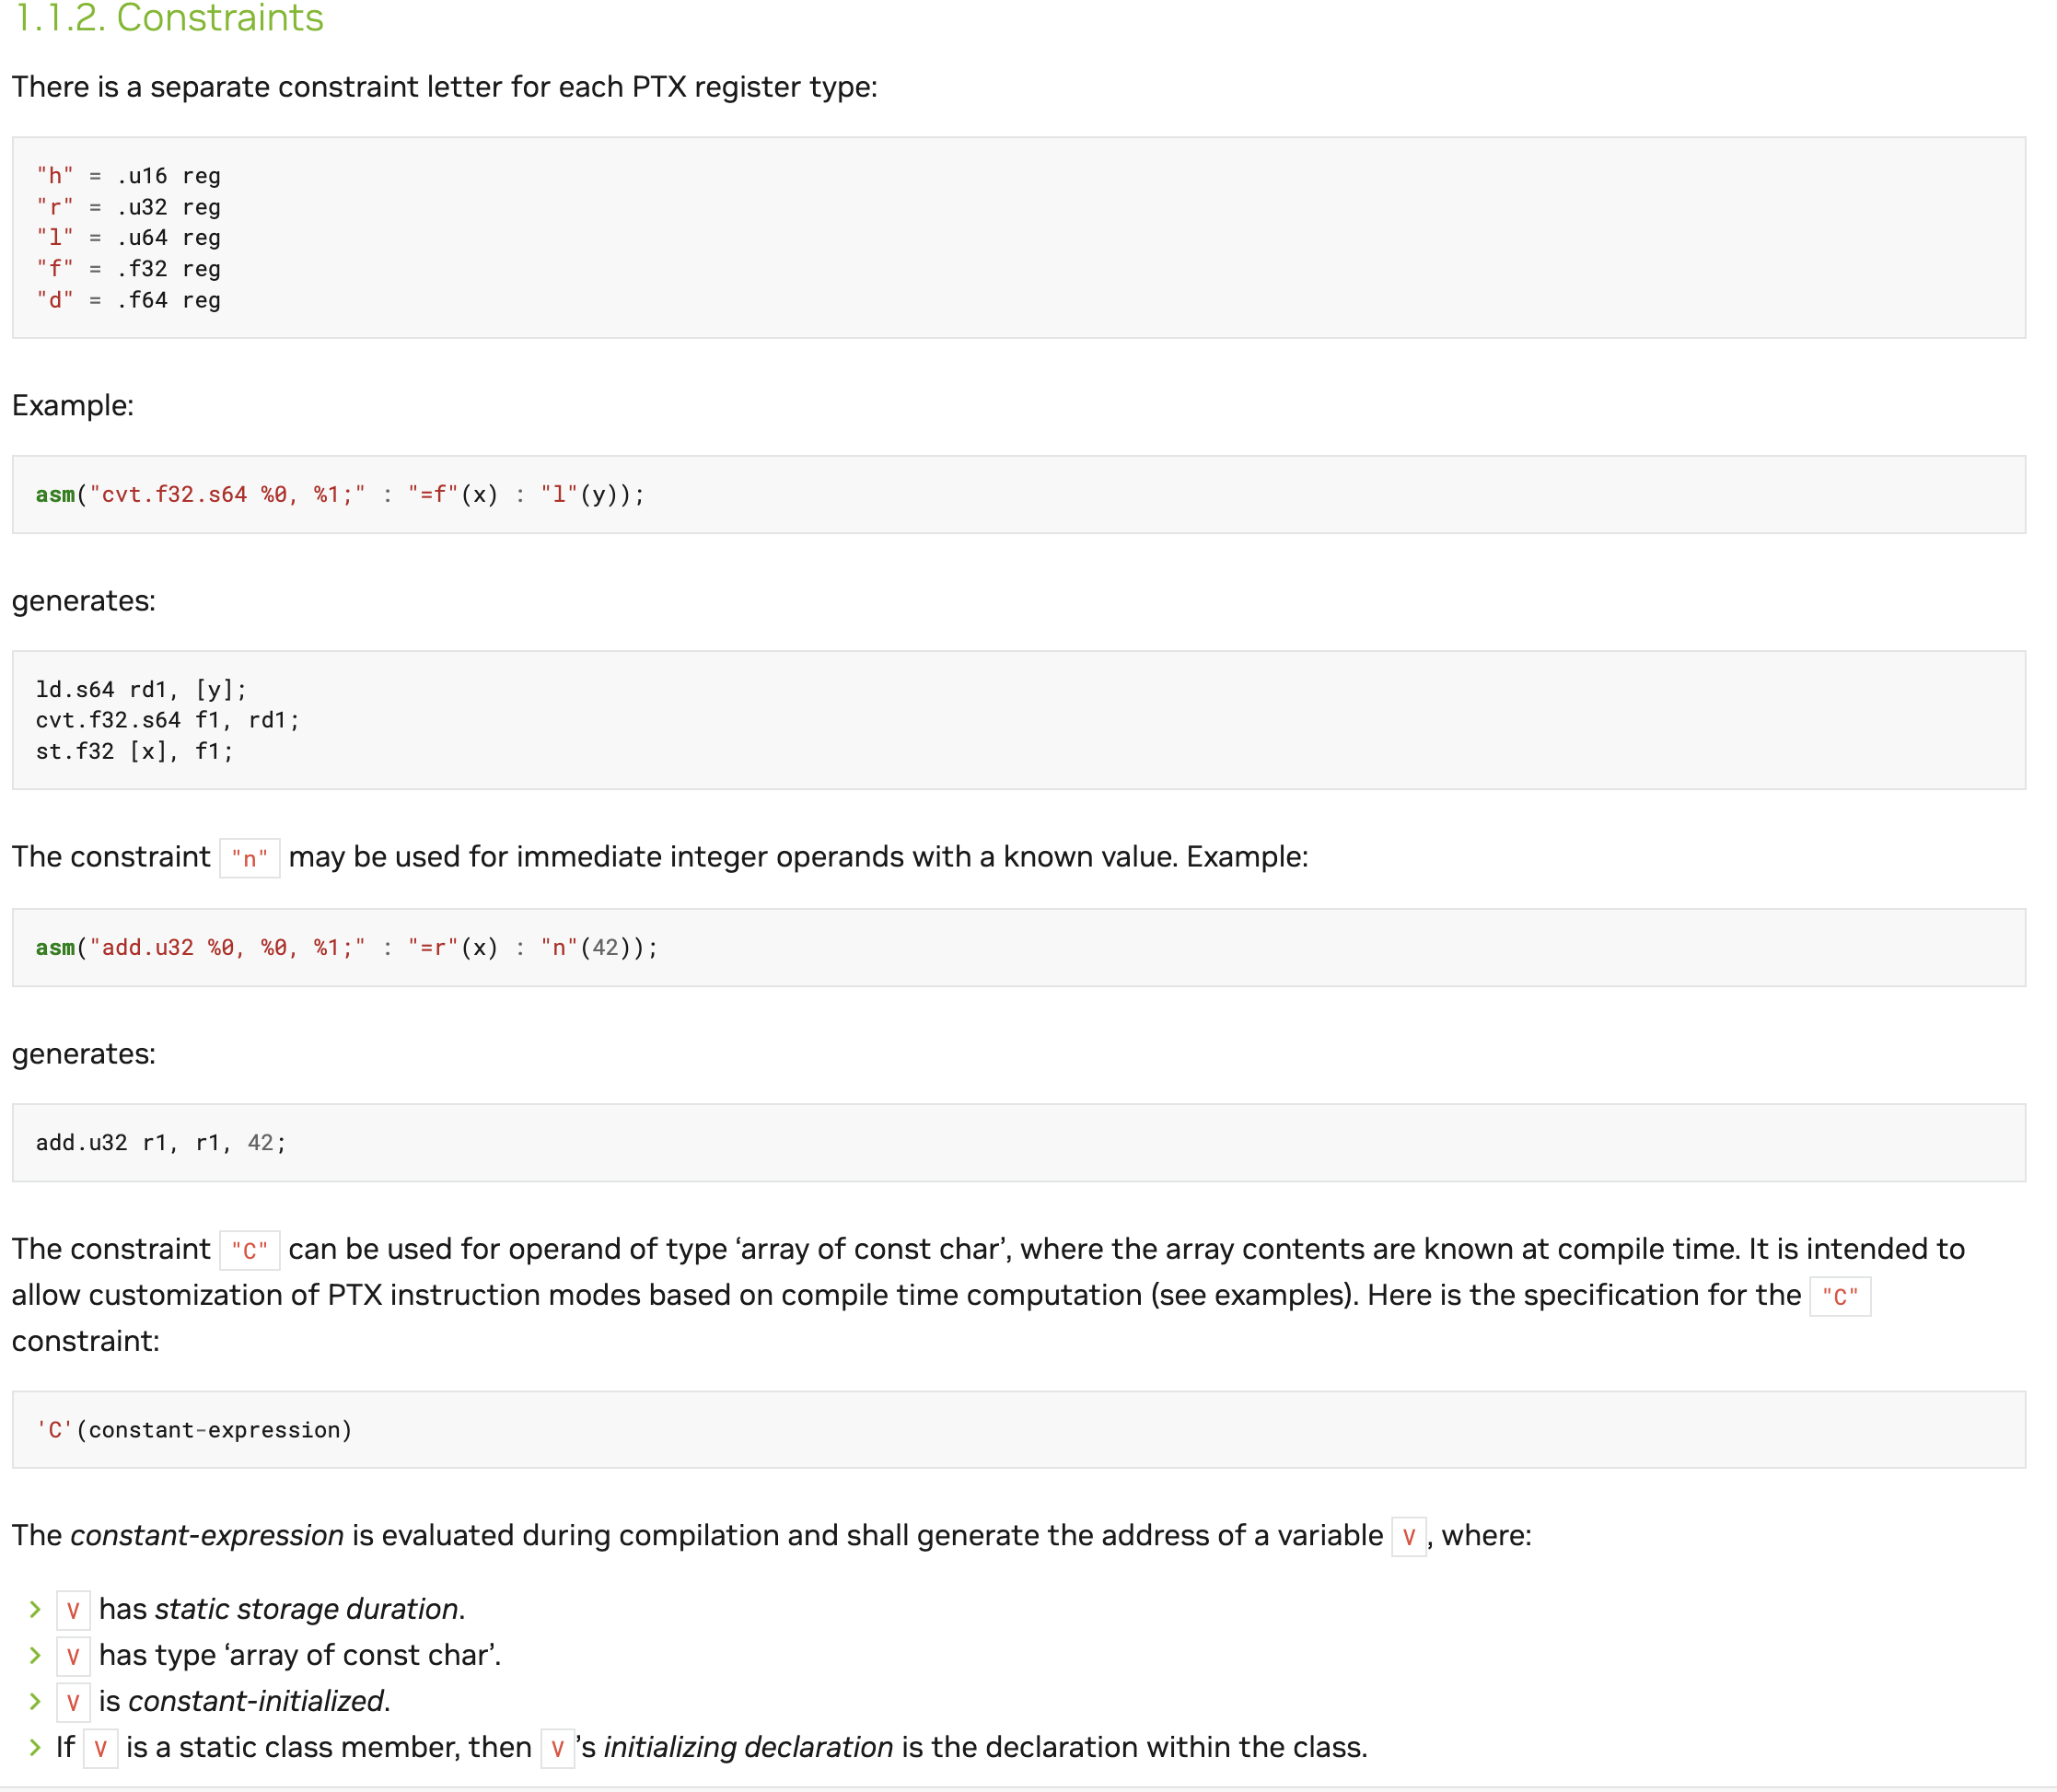
= and read-write + output operandsPointers also belong to Generic, Global, Shared, and other state spaces. Inline PTX cannot infer every pointer’s target state space; verify it before using instructions such as ld.global or ld.shared.

6. Hopper Case Study 1: WGMMA Asynchronous Matrix Pipeline
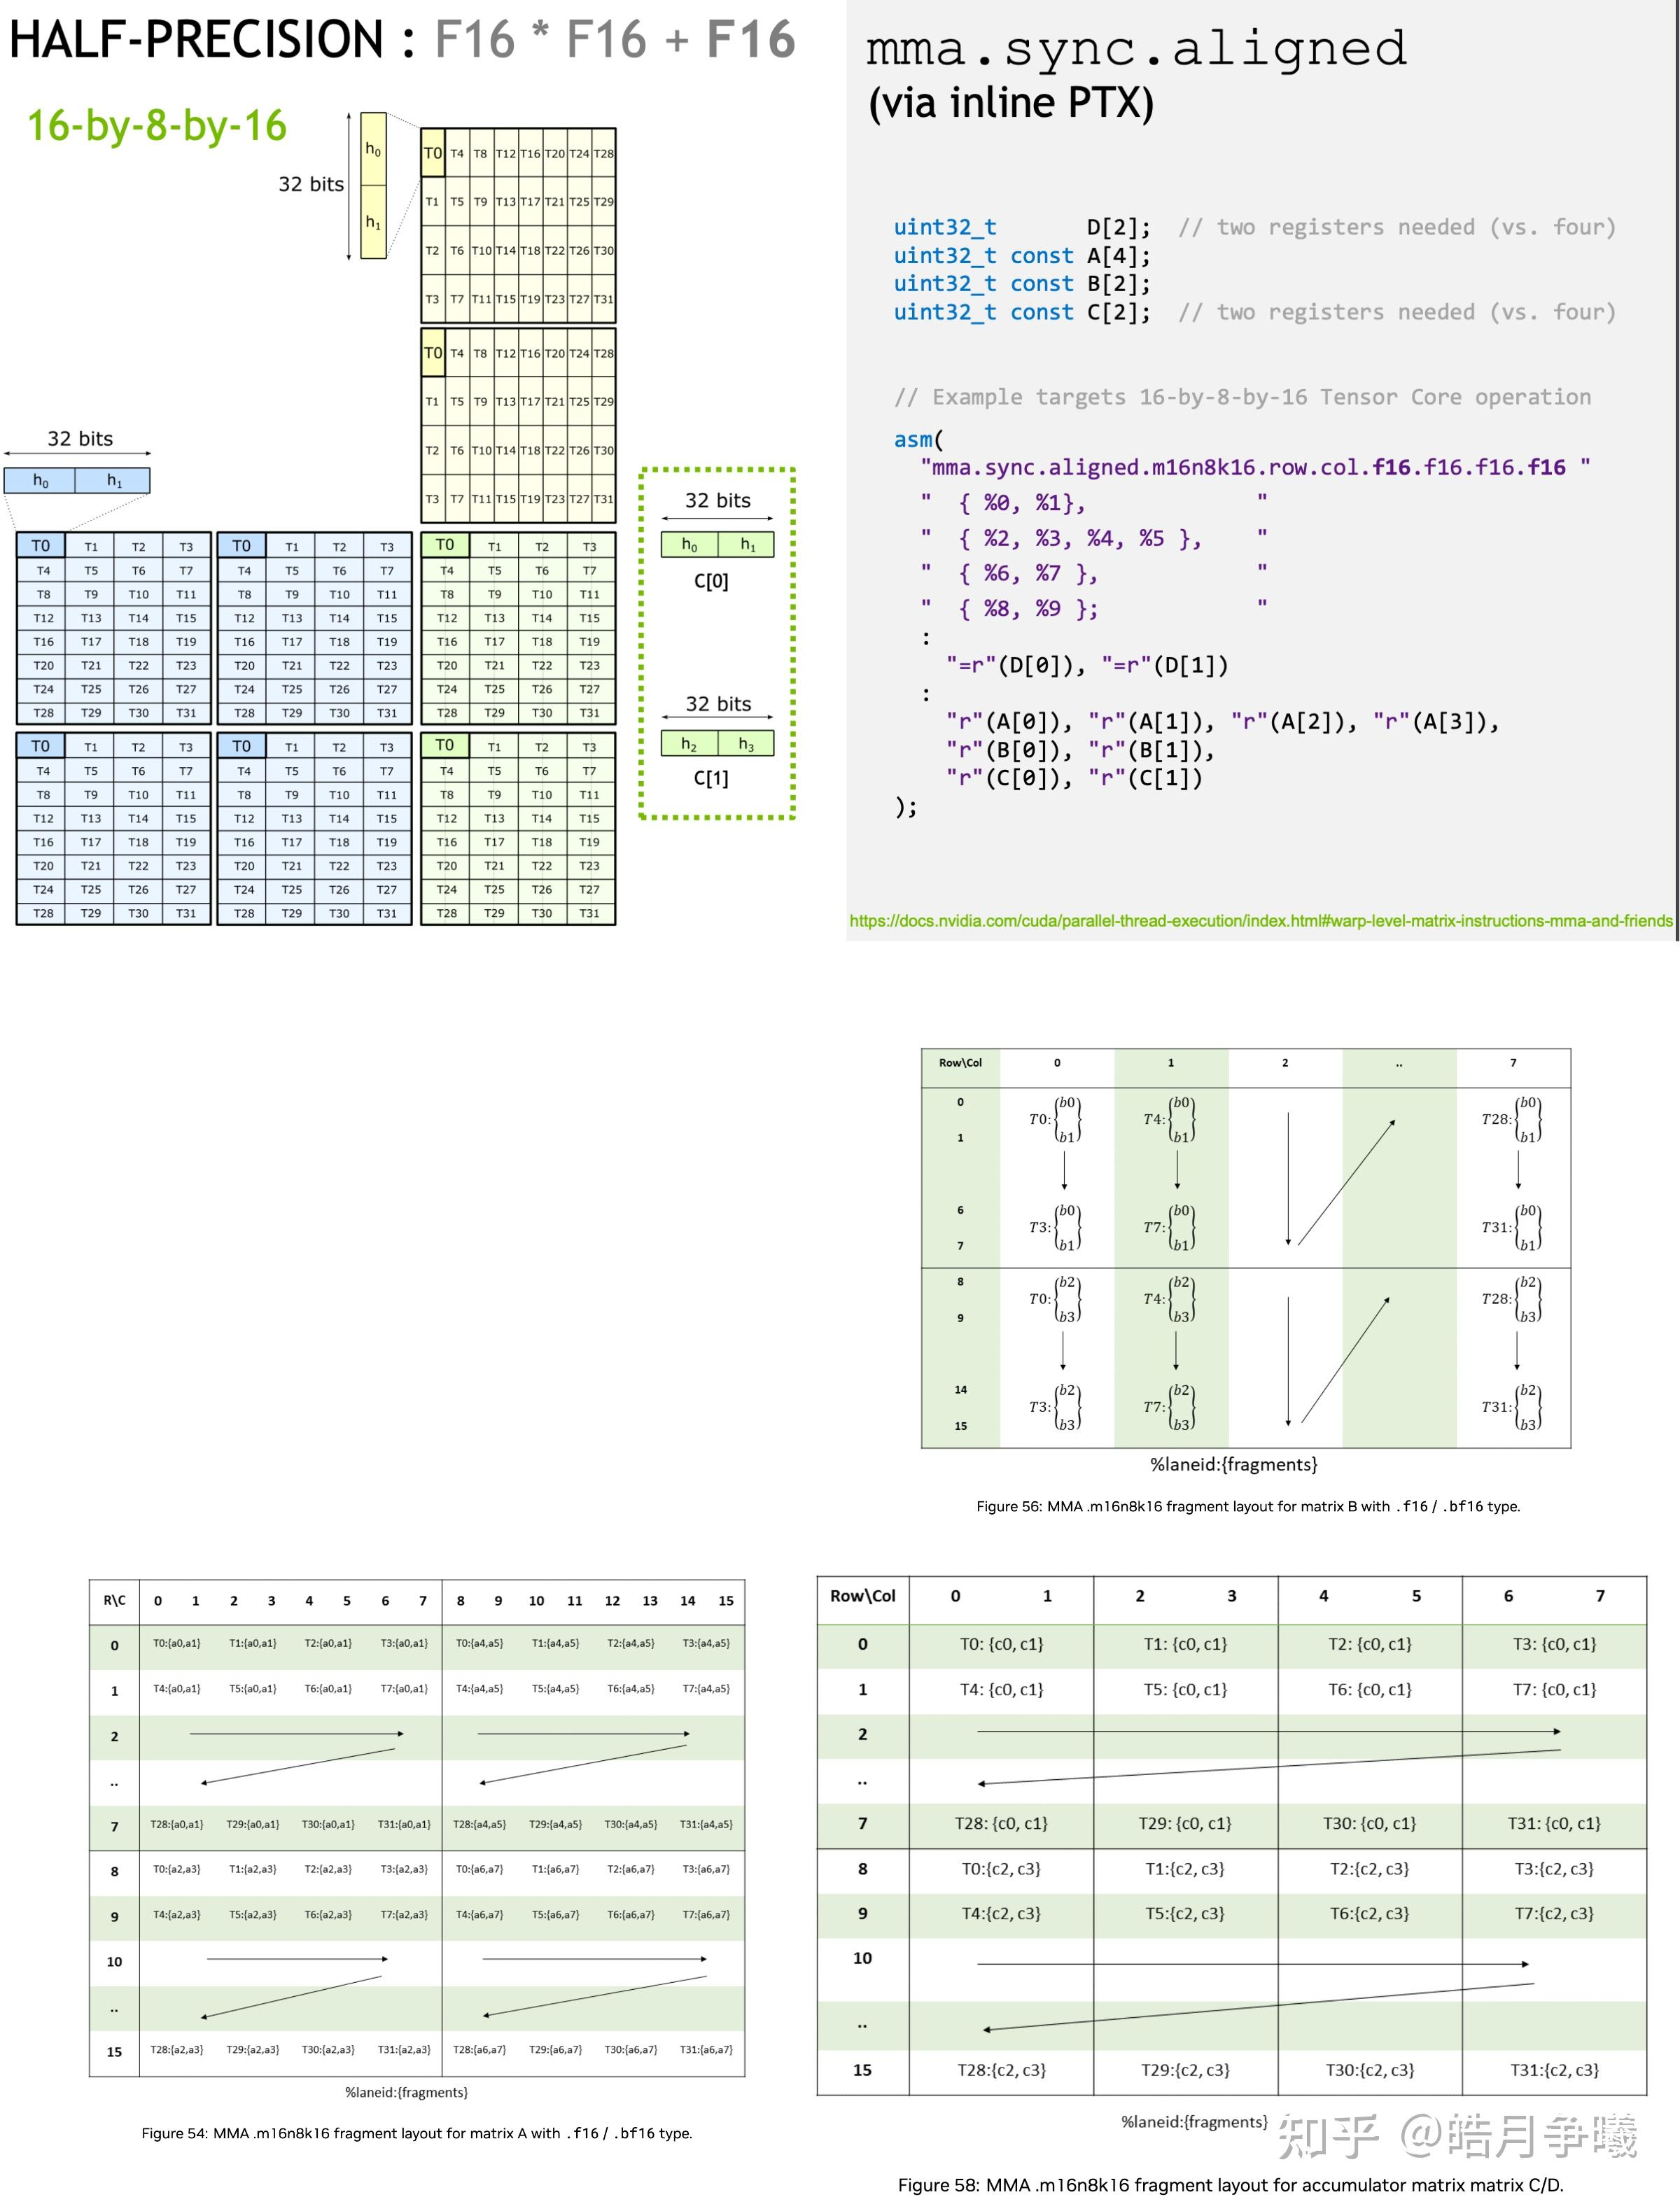
Traditional warp-level MMA loads fragments into registers and lets one warp cooperate. The following figure is useful background for fragment layout, but it is not WGMMA itself.
Hopper WGMMA uses four consecutive warps—128 threads—as one Warp Group to execute:
$$ D=A\times B+C $$A typical control sequence is:
|
|
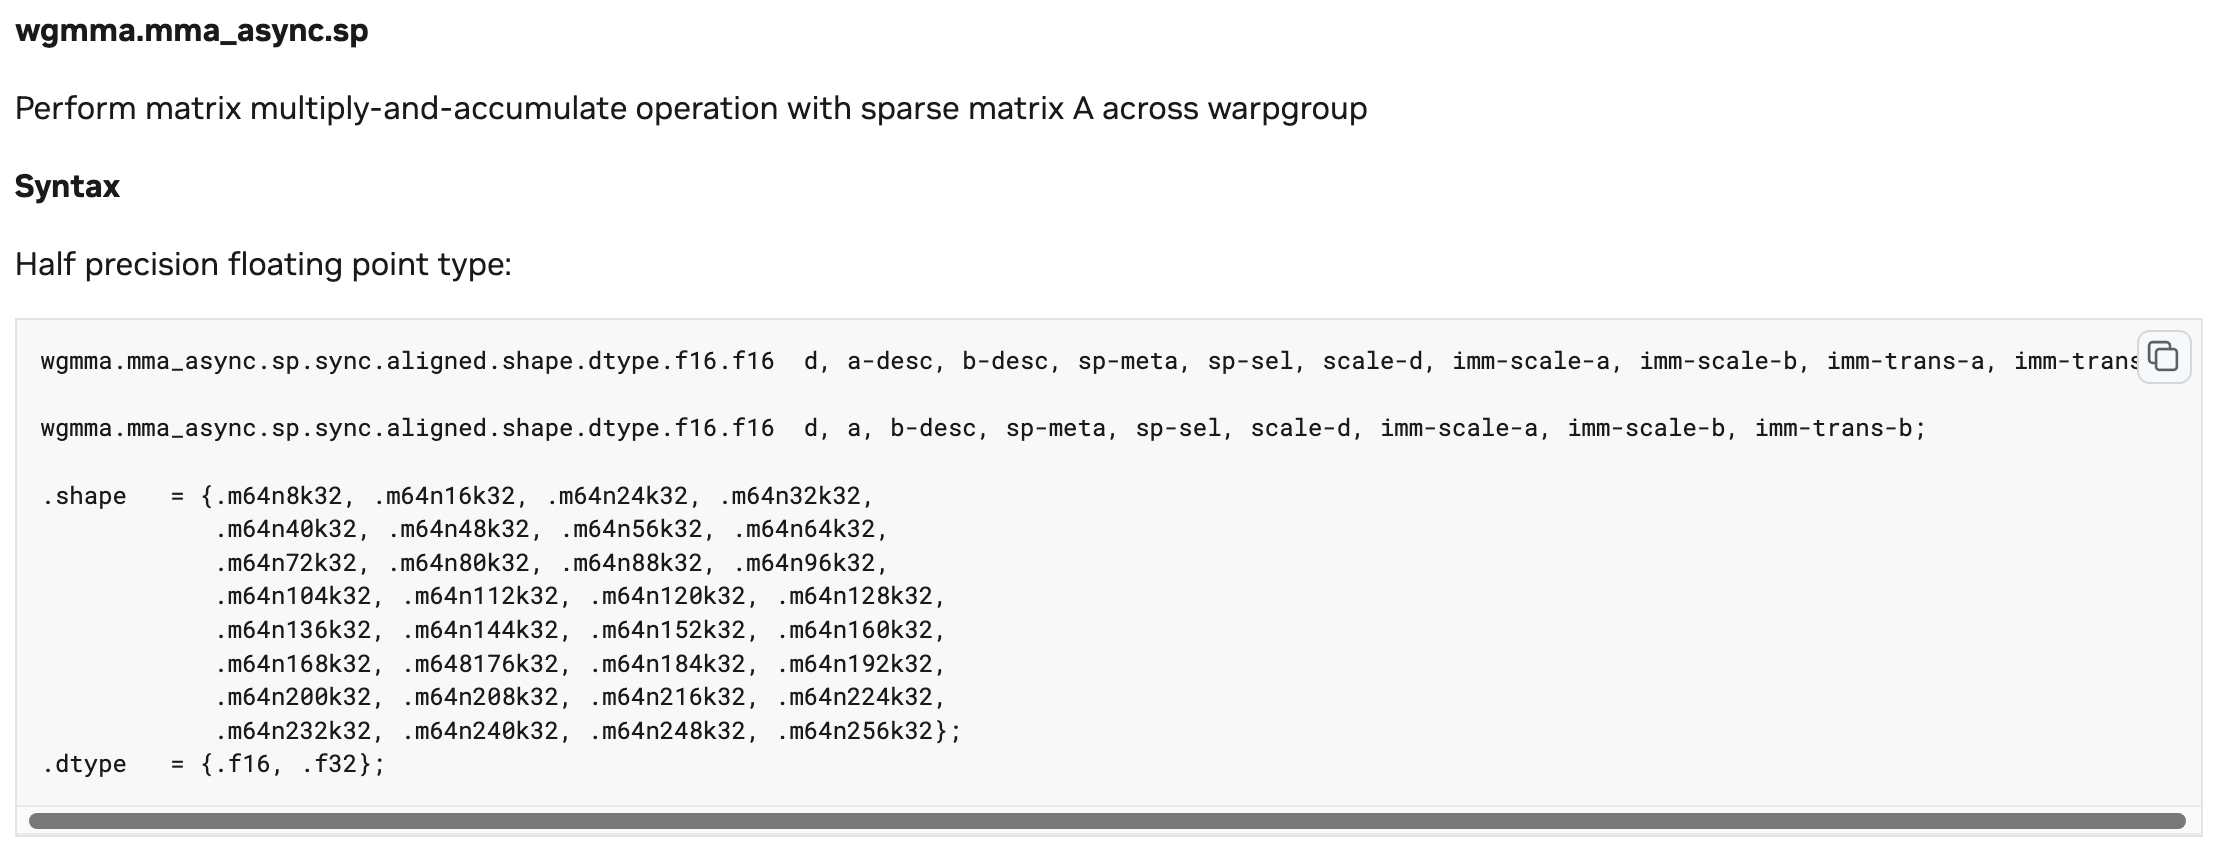
wgmma.fence: orders prior accumulator-register accesses before subsequent WGMMA; Shared Memory operands written through the generic proxy require the corresponding async-proxy fence.mma_async: issues the matrix multiply-accumulate asynchronously.commit_group: commits issued operations as a group.wait_group N: waits until at most N operation groups remain in flight.
.sync makes participating warps rendezvous at the instruction. .aligned requires every thread in the Warp Group to execute the same WGMMA instruction. Divergent execution is undefined.

.sync and .alignedAccumulator D resides in registers. B is supplied through a Shared Memory descriptor; A comes from registers or Shared Memory depending on the instruction variant. The asynchronous interface allows multiple MMA groups to overlap with future data preparation.
A WGMMA throughput benchmark should:
- use enough matrix tiles to occupy multiple Warp Groups;
- use multi-stage buffers to avoid measuring only Shared Memory stalls;
- tune in-flight depth with
commit_group/wait_group; - count real MMA FLOPs and validate output;
- inspect Tensor Core utilization, stall reasons, and Shared Memory throughput.
7. Hopper Case Study 2: TMA Data-Movement Pipeline
The Tensor Memory Accelerator moves large blocks or multidimensional tensors asynchronously between Global and Shared Memory. Compared with Ampere’s LDGSTS path, one elected thread can issue a TMA copy and let the TMA unit perform address generation and transfer while other threads compute.
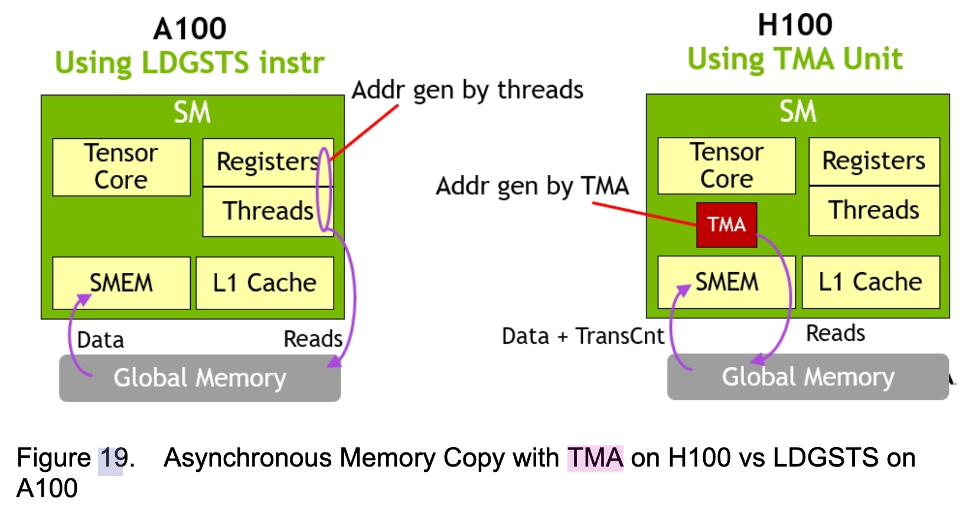
A typical Hopper pipeline is:
|
|
While WGMMA consumes stage N, TMA prefetches stage N+1. Performance comes from copy/compute overlap, not necessarily from lower single-copy latency.
7.1 Descriptor and Alignment
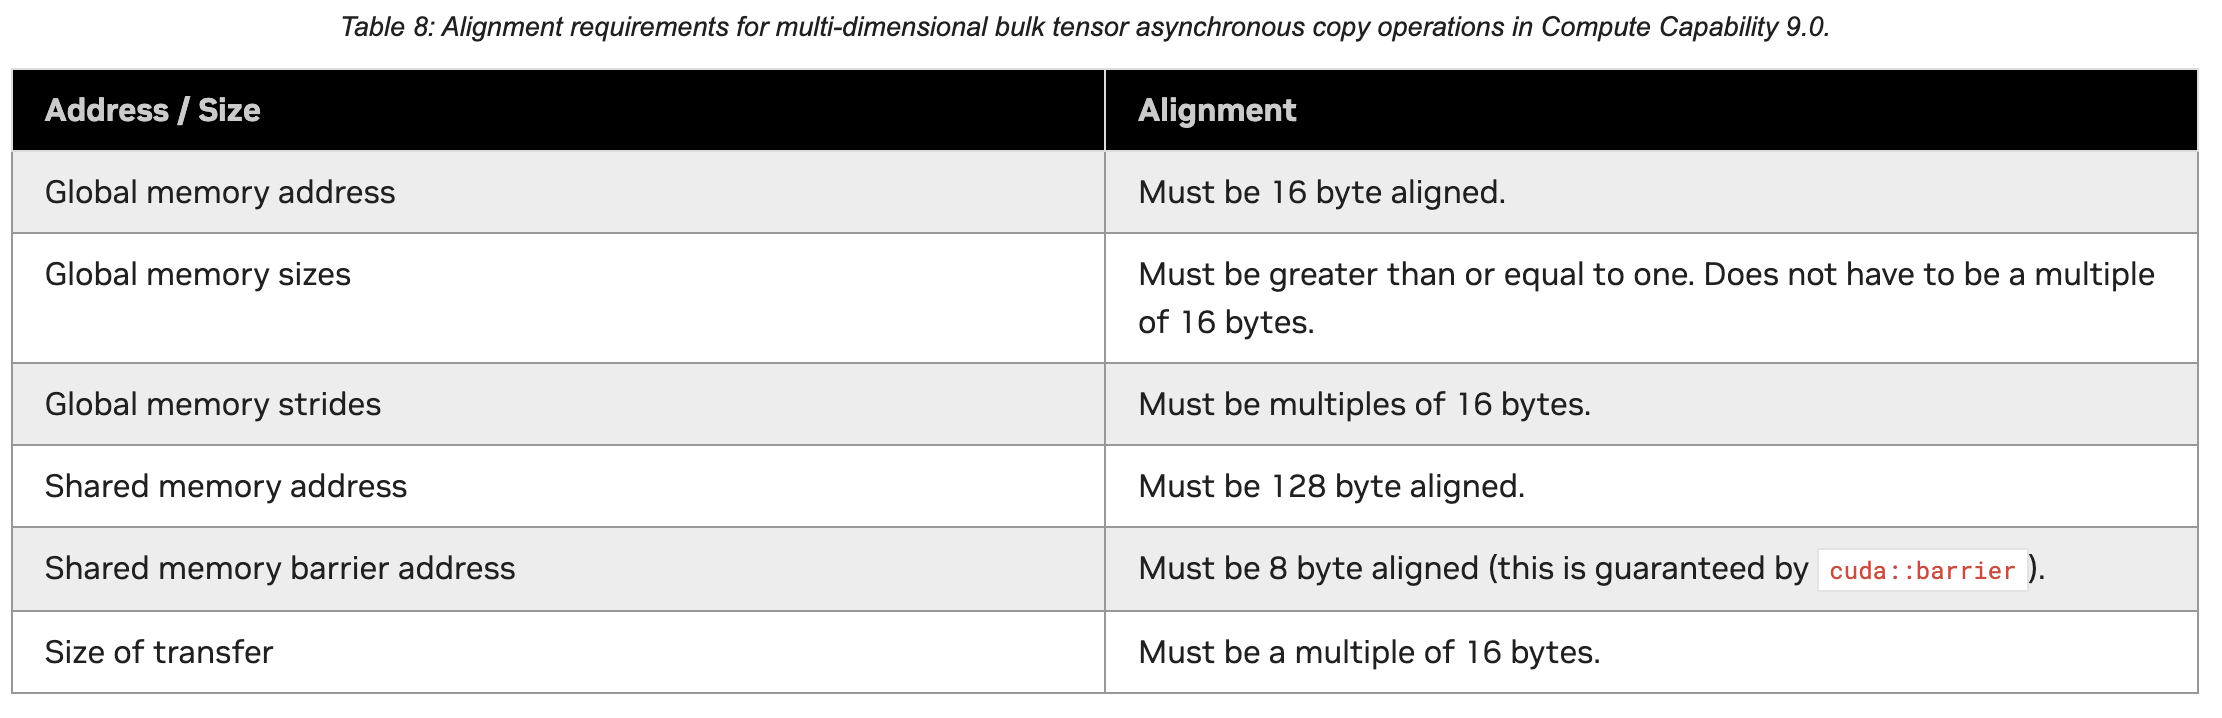
Multidimensional TMA uses a host-created tensor-map descriptor containing base address, dimensions, strides, tile shape, and layout. Device code launches a transfer using the descriptor and coordinates.
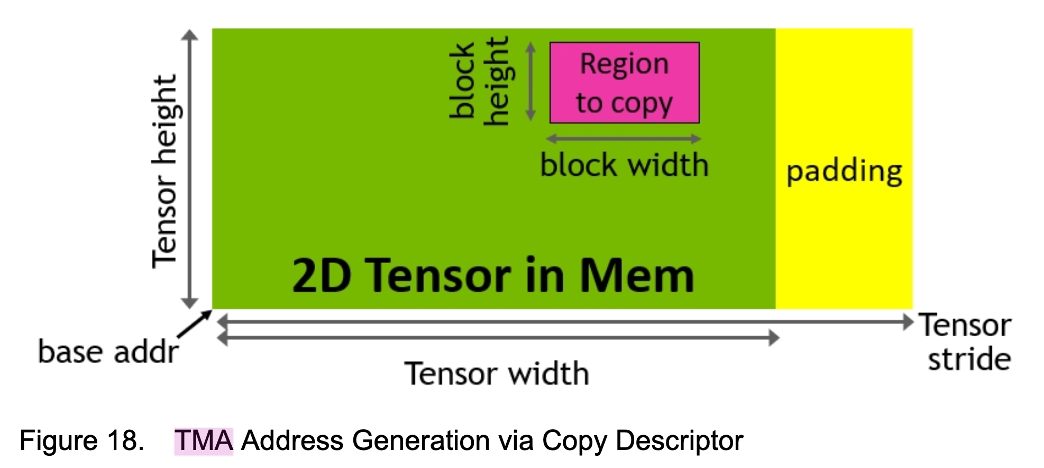
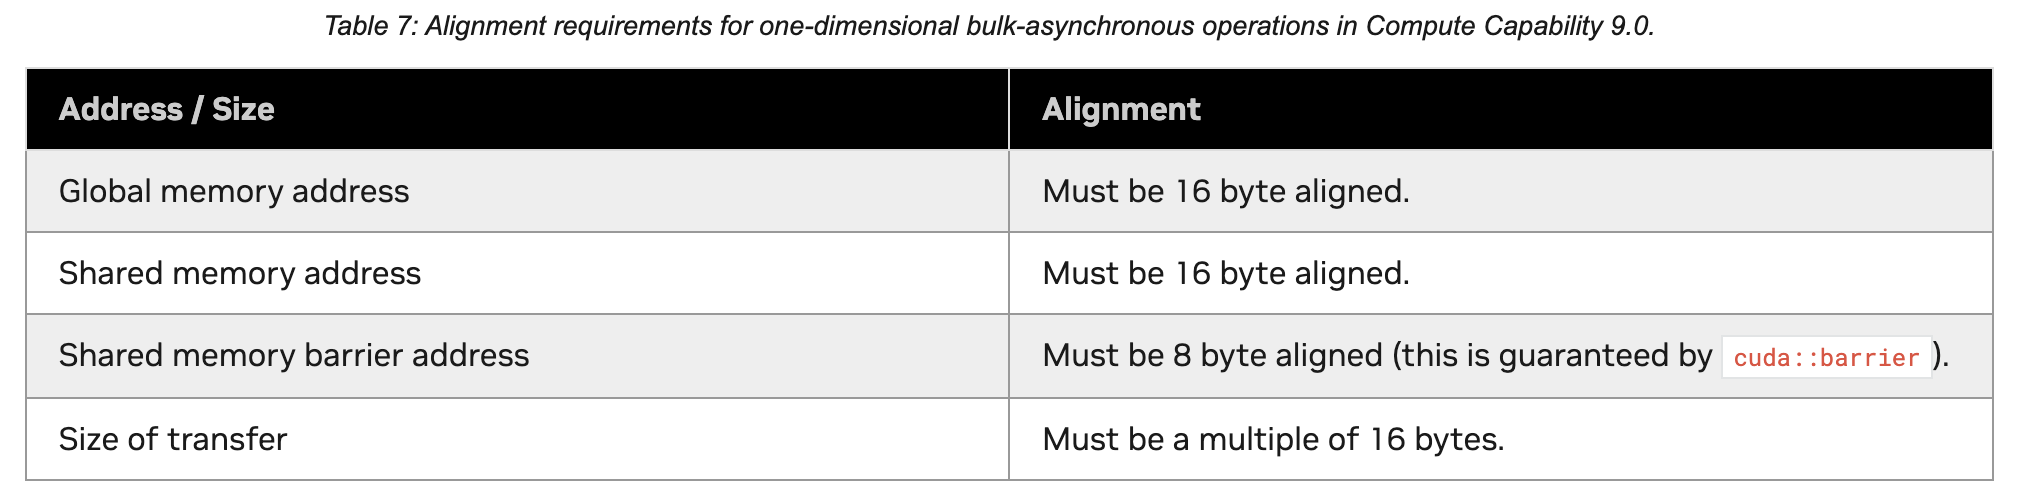
For operations such as cp.async.bulk that require TMA, Global/Shared addresses generally need 16-byte alignment, transfer size must be a multiple of 16 bytes, and the mbarrier address needs 8-byte alignment. Higher-level CUDA APIs may fall back to a synchronous path; direct PTX can become undefined when constraints are violated.
7.2 Completion Depends on Direction
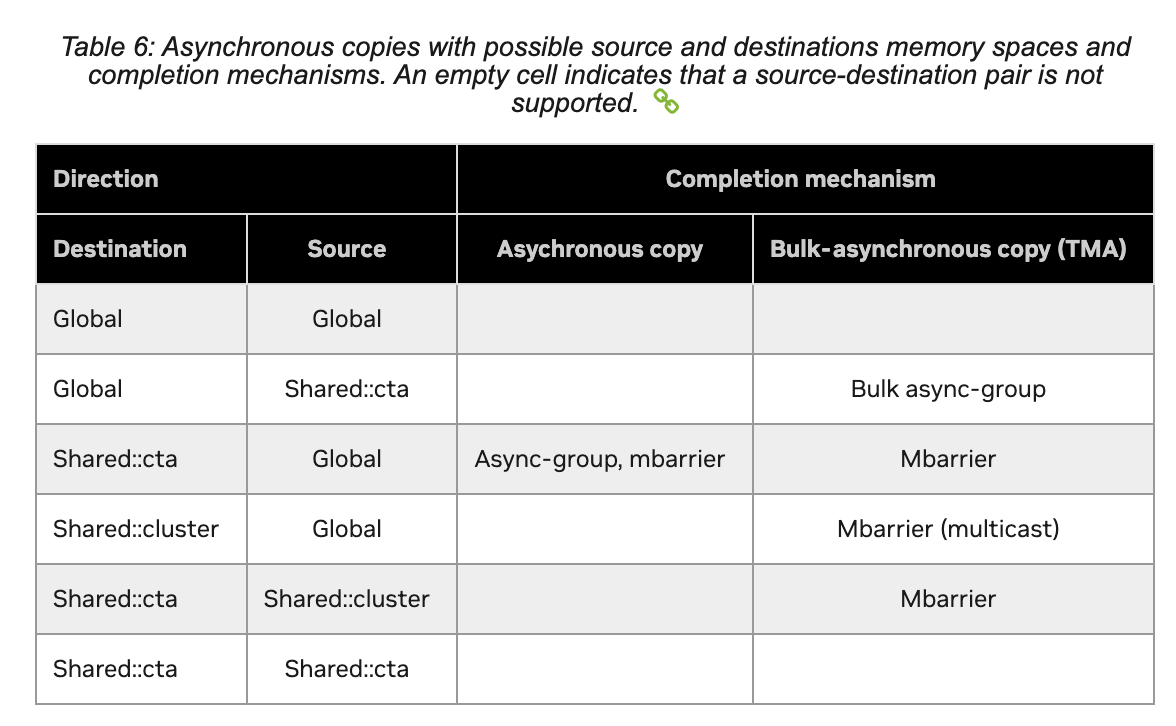
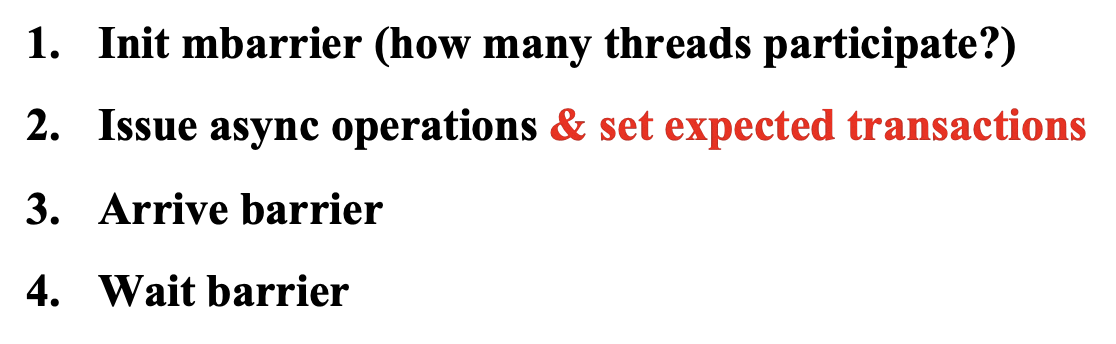
A Global → Shared TMA copy is usually tracked by a transaction-aware mbarrier: initialize the barrier and expected byte count, then let consumers wait for the phase before reading Shared Memory.
A Shared → Global bulk copy usually uses a bulk async-group. Mbarrier and async-group are not interchangeable styles; they correspond to different directions and completion semantics.

A TMA micro-benchmark should separately measure:
- single-copy latency;
- steady-state bandwidth on a large working set;
- end-to-end tile throughput with TMA/WGMMA overlap;
- tile shape, stage count, and cluster-multicast sensitivity.
A copy-only kernel does not prove a faster pipeline. The final comparison must include both movement and computation.
8. Appendix: Related but Not Core to the Benchmark
8.1 DMA and IOMMU
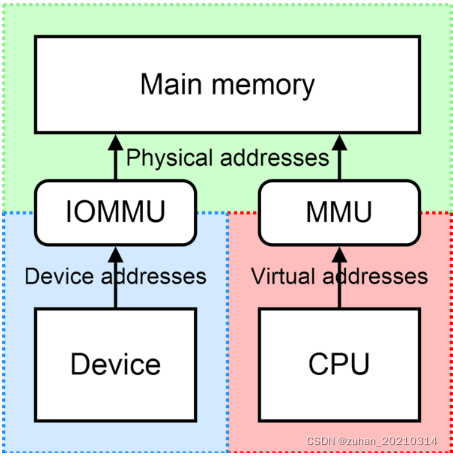
DMA lets devices access memory directly. IOMMU translates and isolates device virtual addresses. They matter for GPU Direct, unified virtual addressing, and device-to-device transfers, but do not directly determine a single-GPU ALU/DRAM micro-benchmark peak.
8.2 Explicit CUDA Template Instantiation
If a template is defined in a .cu file and called from another translation unit, the compiler may not see the definition for the requested specialization. Explicitly instantiate it in the .cu file and declare the interface in a header. This is a build-organization concern, not a GPU performance mechanism.

.cu file
Conclusion
A trustworthy CUDA micro-benchmark is not merely “a tiny kernel plus a timer.” It is a controlled experiment:
- decide whether latency or throughput is being measured;
- control clocks, caches, input size, and warm-up;
- prevent compiler elimination and inspect final SASS;
- validate output and byte/FLOP accounting;
- use profiler evidence to explain deviations from theoretical limits.
On Hopper, WGMMA and TMA push the problem further: performance depends not only on one instruction’s throughput, but on whether Global Memory, Shared Memory, Tensor Cores, and synchronization are organized into a stable multi-stage asynchronous pipeline.