CUDA Performance Profiling Cornerstone: Toolchains, Warp Scheduling, and Nsight Compute
In GPU performance optimization and low-level architecture exploration, Micro-benchmarks are our sharpest tools for understanding hardware behavior. To write CUDA code that achieves ultimate performance, we must not only know “how to write it” but also “how it runs” at the lowest level.
This series of articles systematically organizes knowledge related to CUDA Micro-benchmarks. As the first part of the series, we will start with the foundational compilation toolchain, dive deep into the GPU’s Warp scheduling mechanism, and provide a detailed guide on using Nsight Compute (NCU) for in-depth performance profiling.
1. Compilers and Low-Level Assembly (Compilers, PTX & SASS)
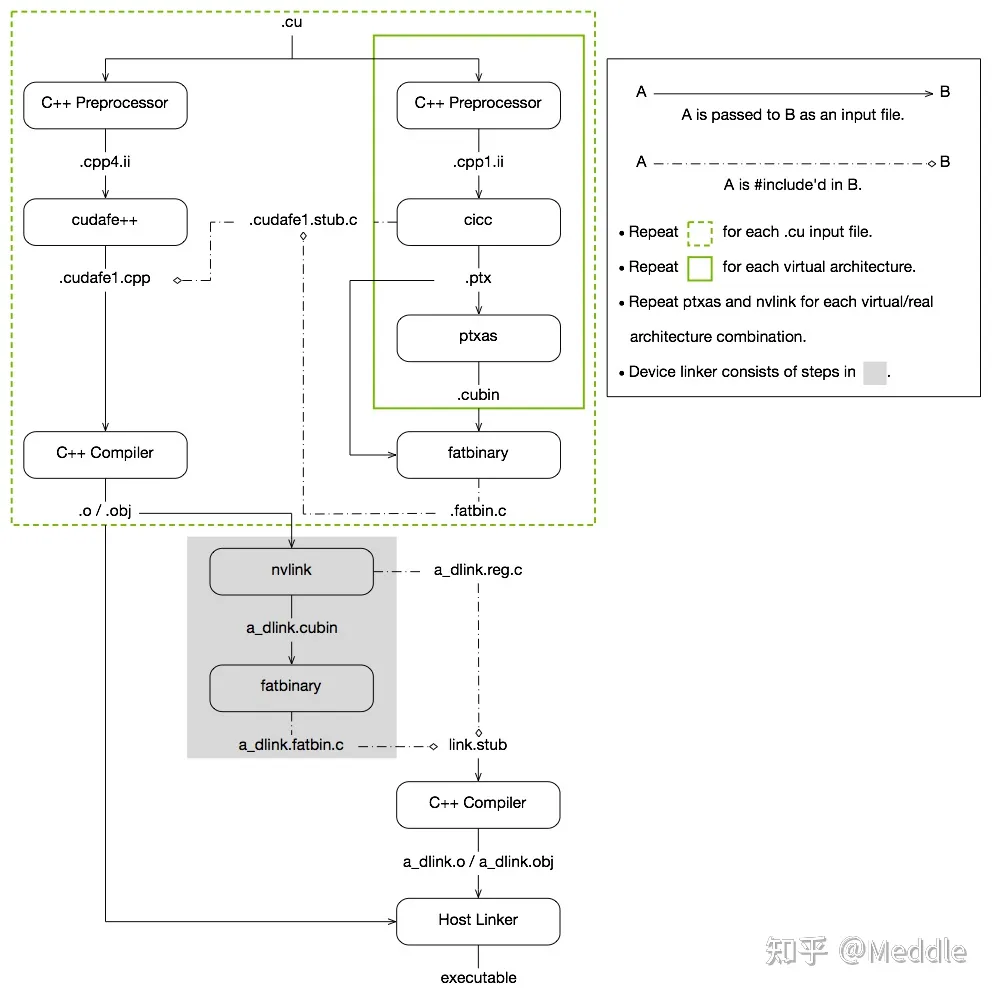
In CUDA programming, the .cu code we write is not directly compiled into machine code. Instead, it undergoes a two-stage compilation process:
nvcc’s frontend,cicc, first compiles the device code into a virtual instruction set called PTX (Parallel Thread Execution).nvcc’s backend,ptxas, then compiles the PTX into architecture-specific machine code called SASS (Streaming ASSembler), packaging it into acubinfile.
1.1 Generating PTX and SASS
To deeply understand what instructions the hardware is actually executing, inspecting PTX and SASS is an indispensable step.
Methods to generate PTX:
- Directly from source code:
nvcc --ptx a.cu -o a.ptx - Extracting from a compiled binary:
cuobjdump -ptx cudatest.exe > cudatest.ptx
Methods to generate SASS:
- Disassembling a binary:
cuobjdump -sass cudatest.exe > cudatest.sass
1.2 Controlling Compilation Optimization
By default, nvcc enables aggressive -O3 level optimization. However, when writing Micro-benchmarks, we often need to completely disable optimization to prevent the compiler from deleting our carefully designed empty loops or side-effect-free test code (Dead Code Elimination).
The complete compilation flags to disable optimization are as follows:
|
|
-Xcicc -O0: Tellsciccto disable optimization during PTX generation.-Xptxas -O0: Tellsptxasto disable optimization during SASS generation.-Xcompiler -O0: Tells the underlying Host C++ compiler (e.g., GCC/MSVC) to disable optimization.
2. CUDA Binary Utility Tools
Besides cuobjdump, the CUDA Toolkit provides a suite of powerful binary analysis and instrumentation tools:
- Disassembler:
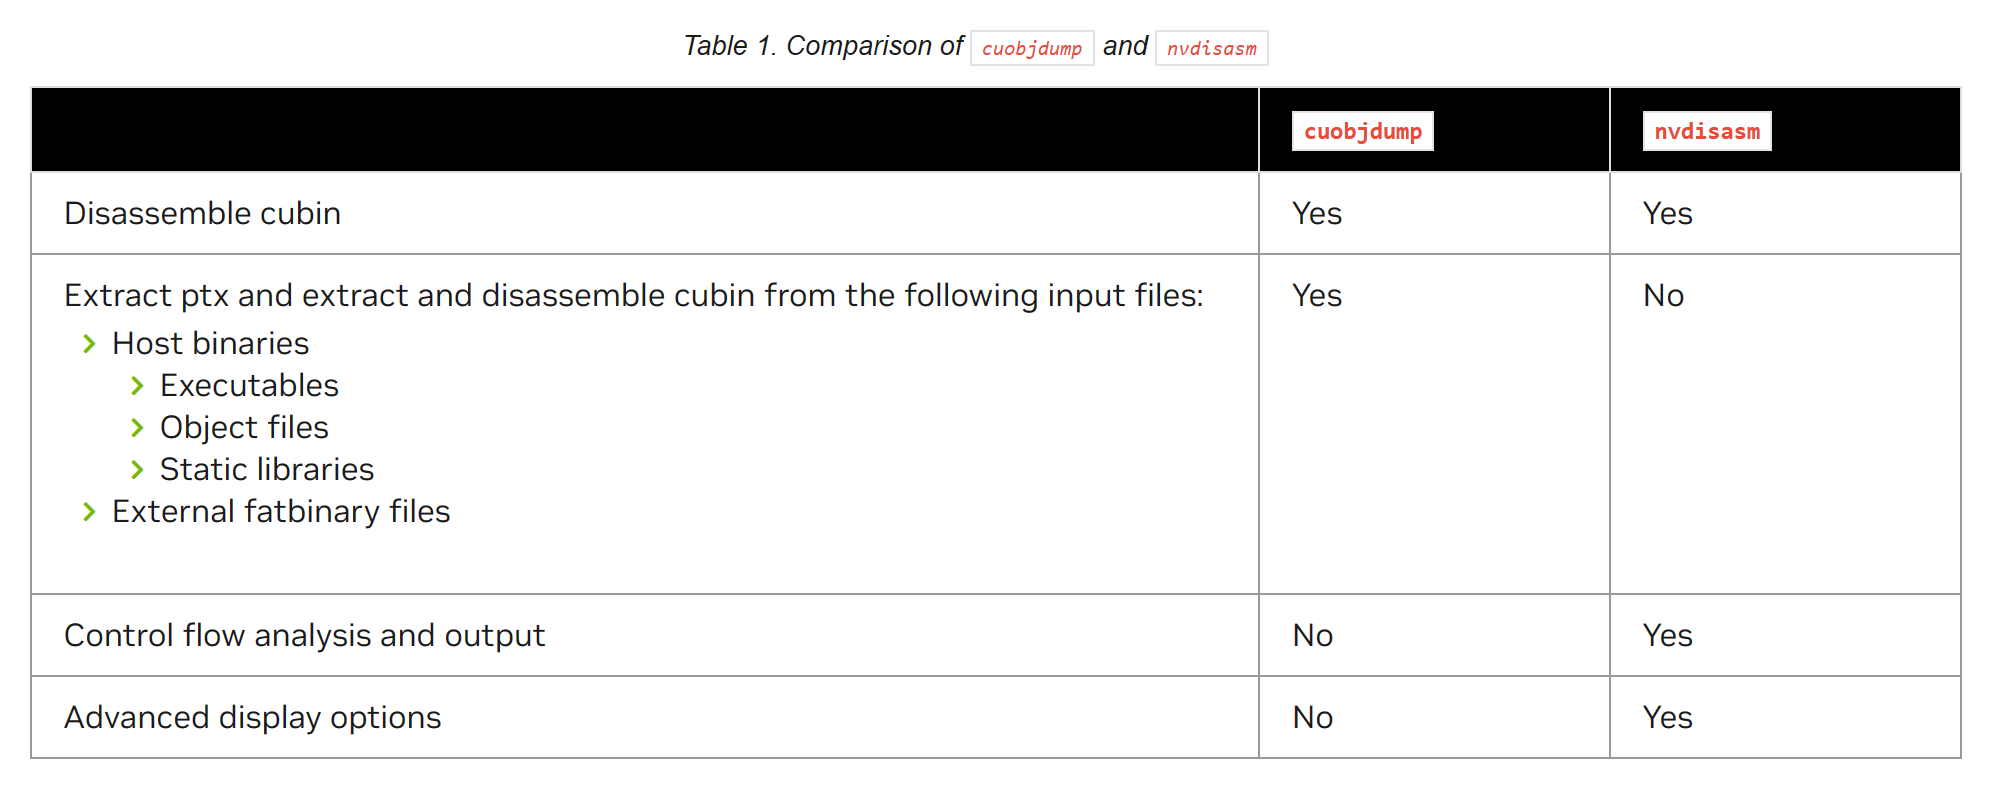
cuobjdumpandnvdisasm, used for viewing and analyzing low-level SASS instruction streams.
cuobjdump and nvdisasm - Demangle:
cu++filt. Because C++ supports function overloading, compiled symbols are mangled into a long string of gibberish. This tool restores them to readable function names. - nvprune: Used to prune Host-side object files and libraries so they only contain Device code for specified Target architectures, thereby reducing binary size.
- NVBit (NVidia Binary Instrumentation Tool): A powerful low-level binary instrumentation framework. It allows researchers to dynamically modify or monitor the execution of GPU programs (e.g., tracing all memory access addresses) without recompiling the source code.
3. Deep Dive into Warp Scheduling
Before discussing performance analysis, we must first understand how the GPU executes instructions. In CUDA, every 32 threads are “bundled” into an execution unit called a Warp. All threads within a Warp execute the same instruction at any given time (SIMT architecture).
3.1 Warp Lifecycle and States
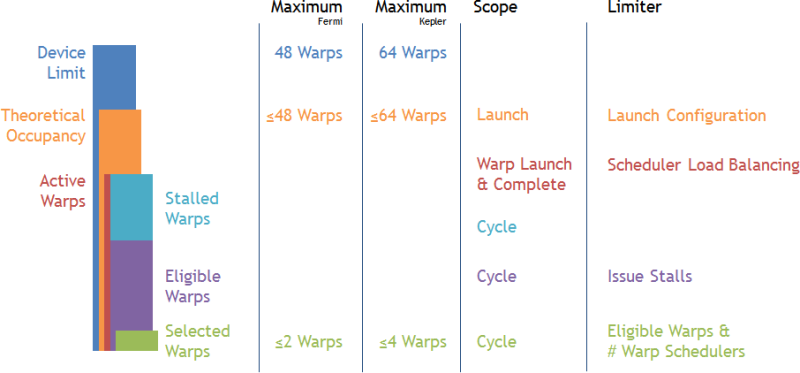
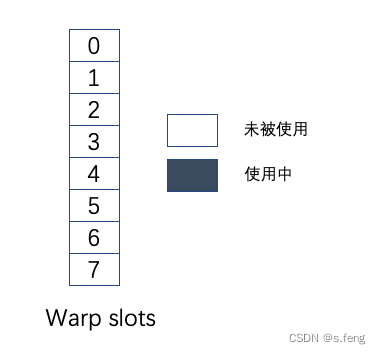
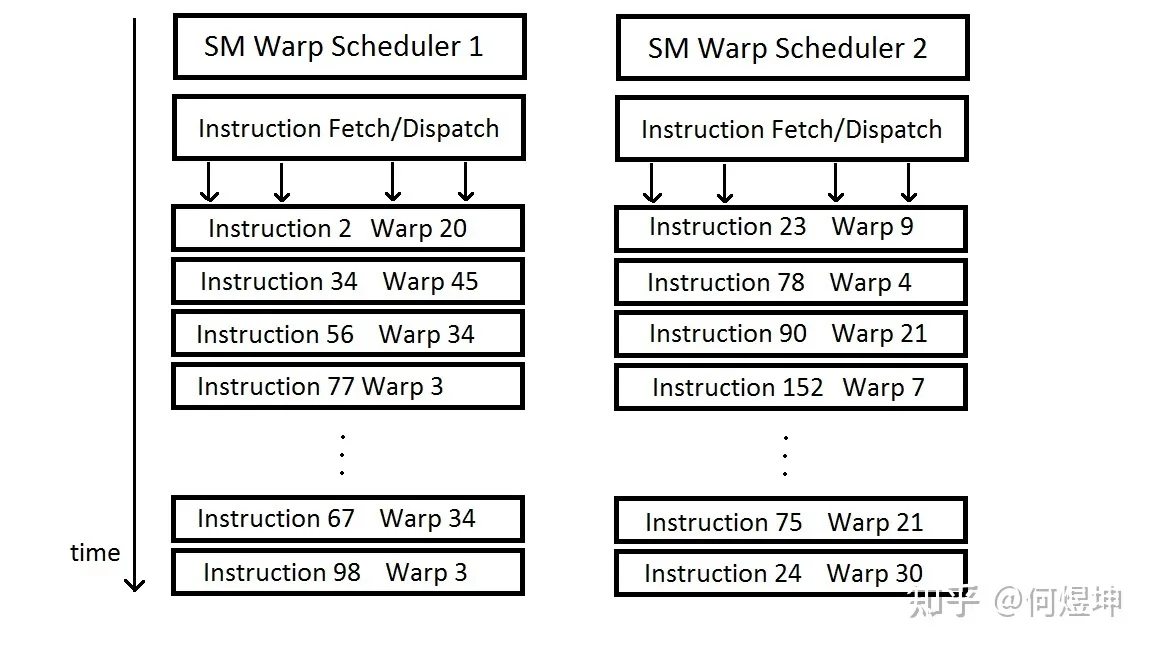
Each SM (Streaming Multiprocessor) contains multiple Warp Schedulers (e.g., the Kepler architecture has 4). Each Scheduler maintains a pool of “Warp Slots.” Warps that enter this pool are called Active Warps.
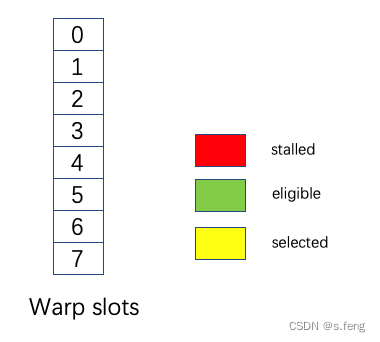
Active Warps constantly transition between three states:
- Eligible: The current instruction is ready (no data dependencies or resource conflicts) and can be issued for execution.
- Selected: A Warp chosen from the Eligible Warps by the Scheduler to actually issue an instruction.
- Stalled: An Active Warp that cannot issue an instruction due to various reasons (e.g., waiting for memory reads, waiting for the result of a previous instruction, waiting at a synchronization barrier).
3.2 Basic Logic of Instruction Issue
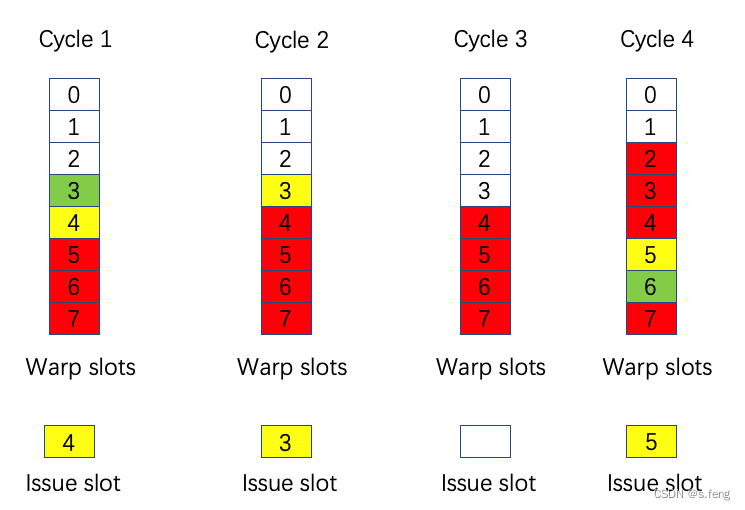
The basic steps of Warp execution are as follows:
- Thread Grouping: Mapping user-specified Threads into Warps.
- Fetch and Decode: Fetching and decoding instructions.
- Instruction Issue: Only Warps marked as Ready in the Scoreboard can issue instructions. If there are multiple, the Scheduler uses strategies like Round-Robin to schedule them.
- Context Switching: When the current Warp encounters a long-latency operation (like reading/writing Global Memory), the Scheduler suspends (Stalls) it, saves its state, and switches to another Eligible Warp with zero-overhead, thereby hiding the latency.
- Divergence Handling: When an
if-elsestatement causes threads within a Warp to take different branches, the Scheduler constructs a 32-bit Warp Mask and pushes it onto the Branch Synchronization Stack. The hardware will serialize the execution of all branches until they reconverge.
4. Nsight Compute (NCU) Performance Profiling and Deep Stall Analysis
Nsight Compute is NVIDIA’s official Kernel-level performance analysis artifact.
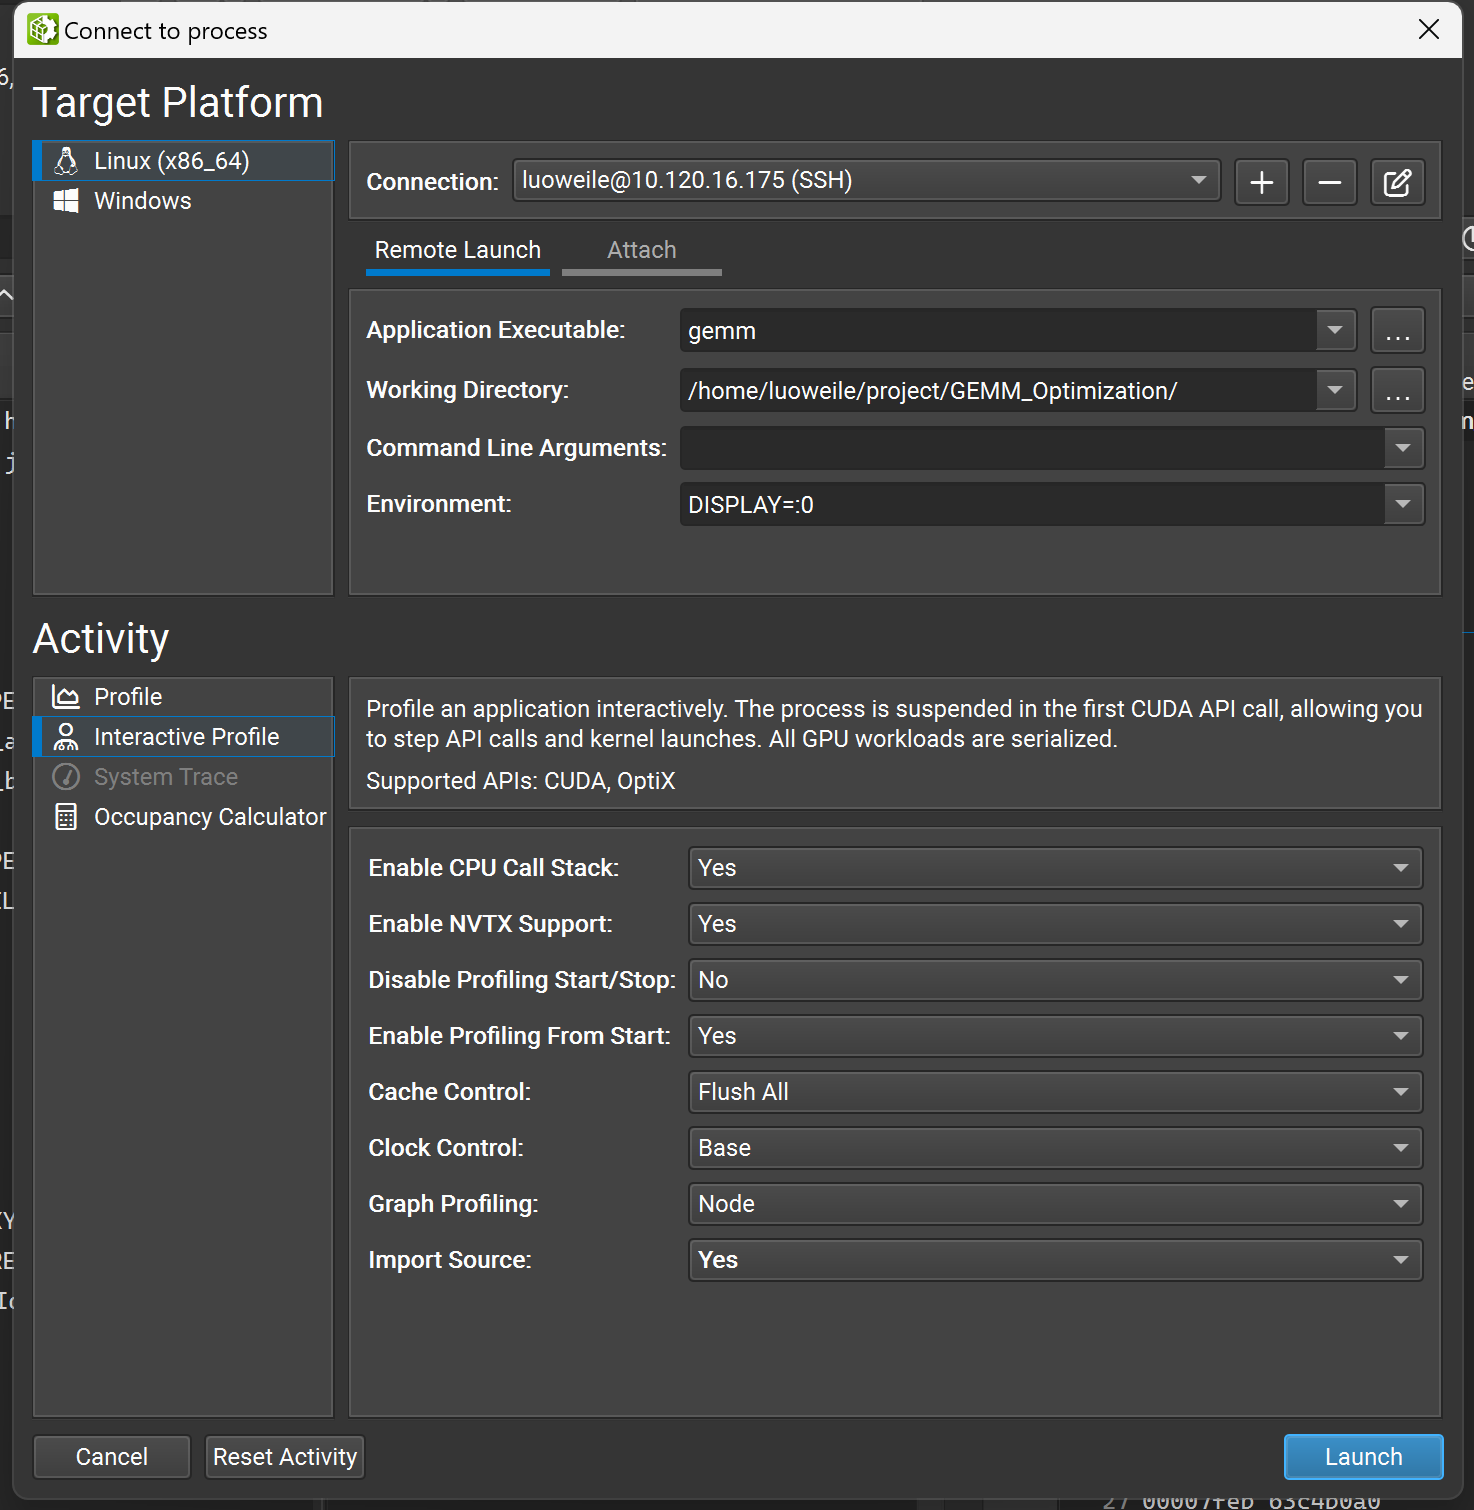
4.1 Command-Line Usage and Source-Level Profiling
When running tests on a server, we typically use the command-line tool ncu to generate a report, which is then downloaded and opened locally with the GUI:
|
|
-s 1 -c 3: Skip the 1st kernel, and only profile the 2nd, 3rd, and 4th kernels.--set full: Collect the full set of detailed performance metrics.
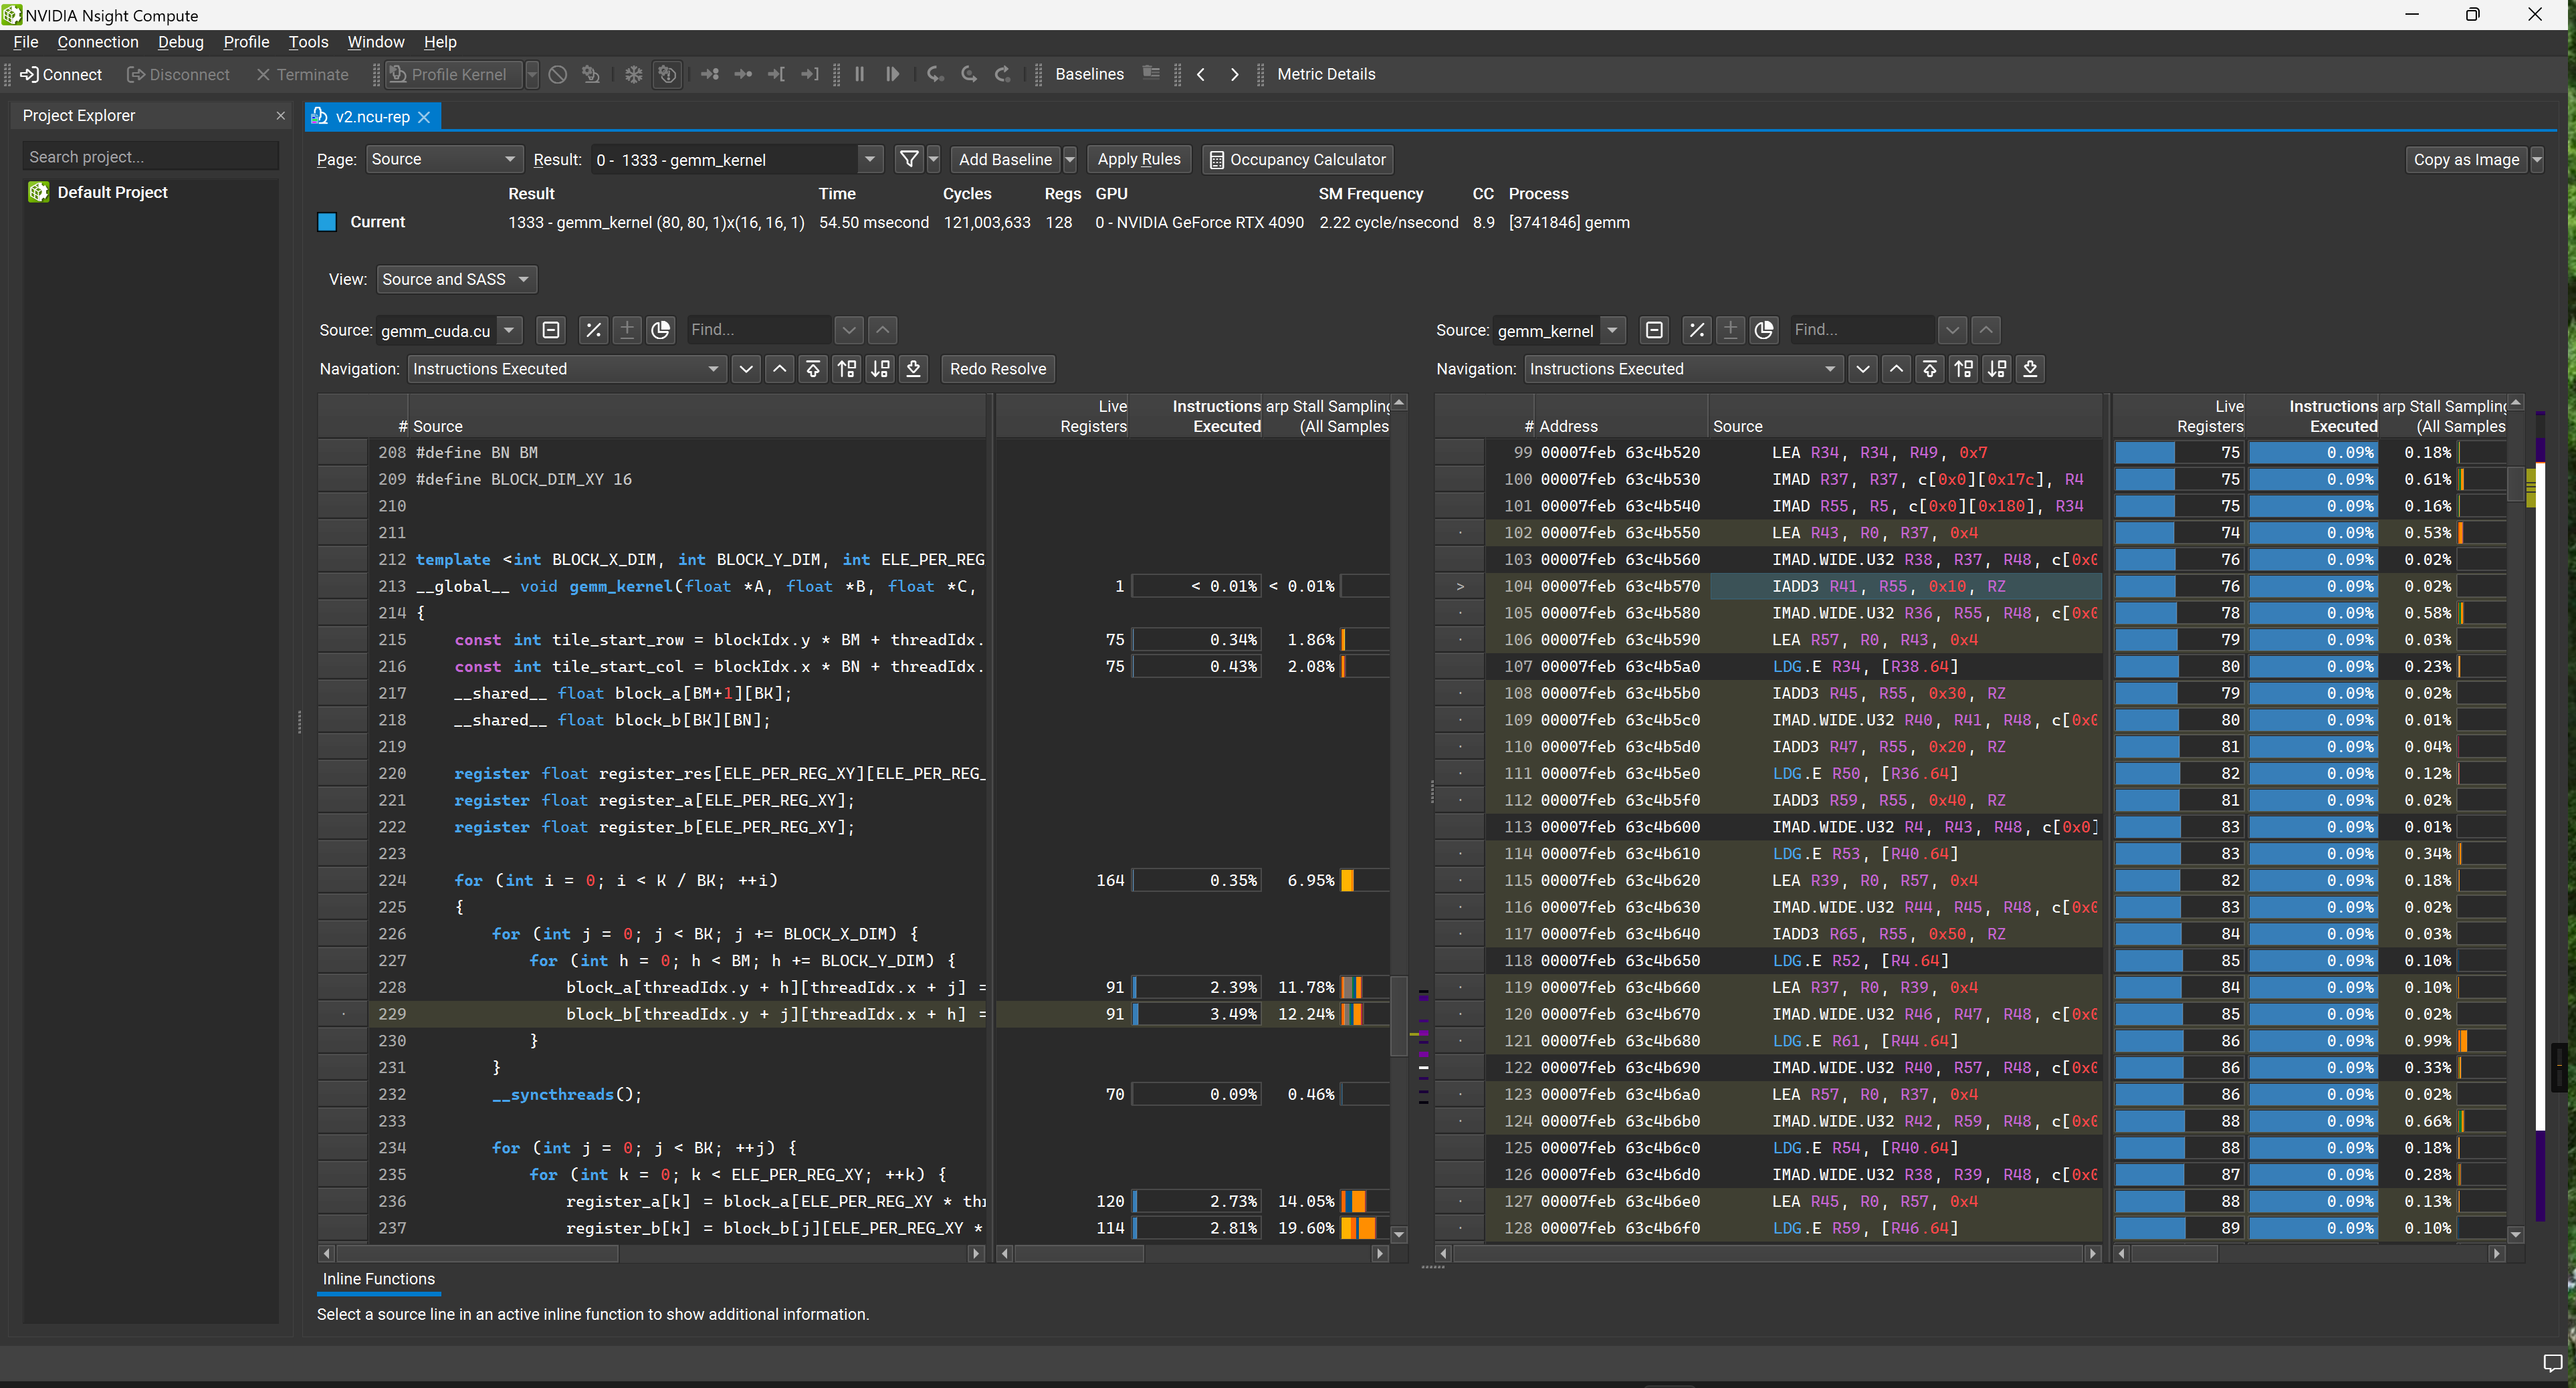
Source-Level Profiling (Finding Code Hotspots):
If you want to see exactly which line of C++ code or PTX instruction caused a performance bottleneck in NCU, you must compile with the -lineinfo flag. This allows NCU to map SASS instructions back to the source code.
4.2 Core Metric Analysis: Warp Stall Statistics
In the NCU report, the most critical section is the Warp State Statistics. It tells us exactly why the GPU’s compute units are not running at full speed.
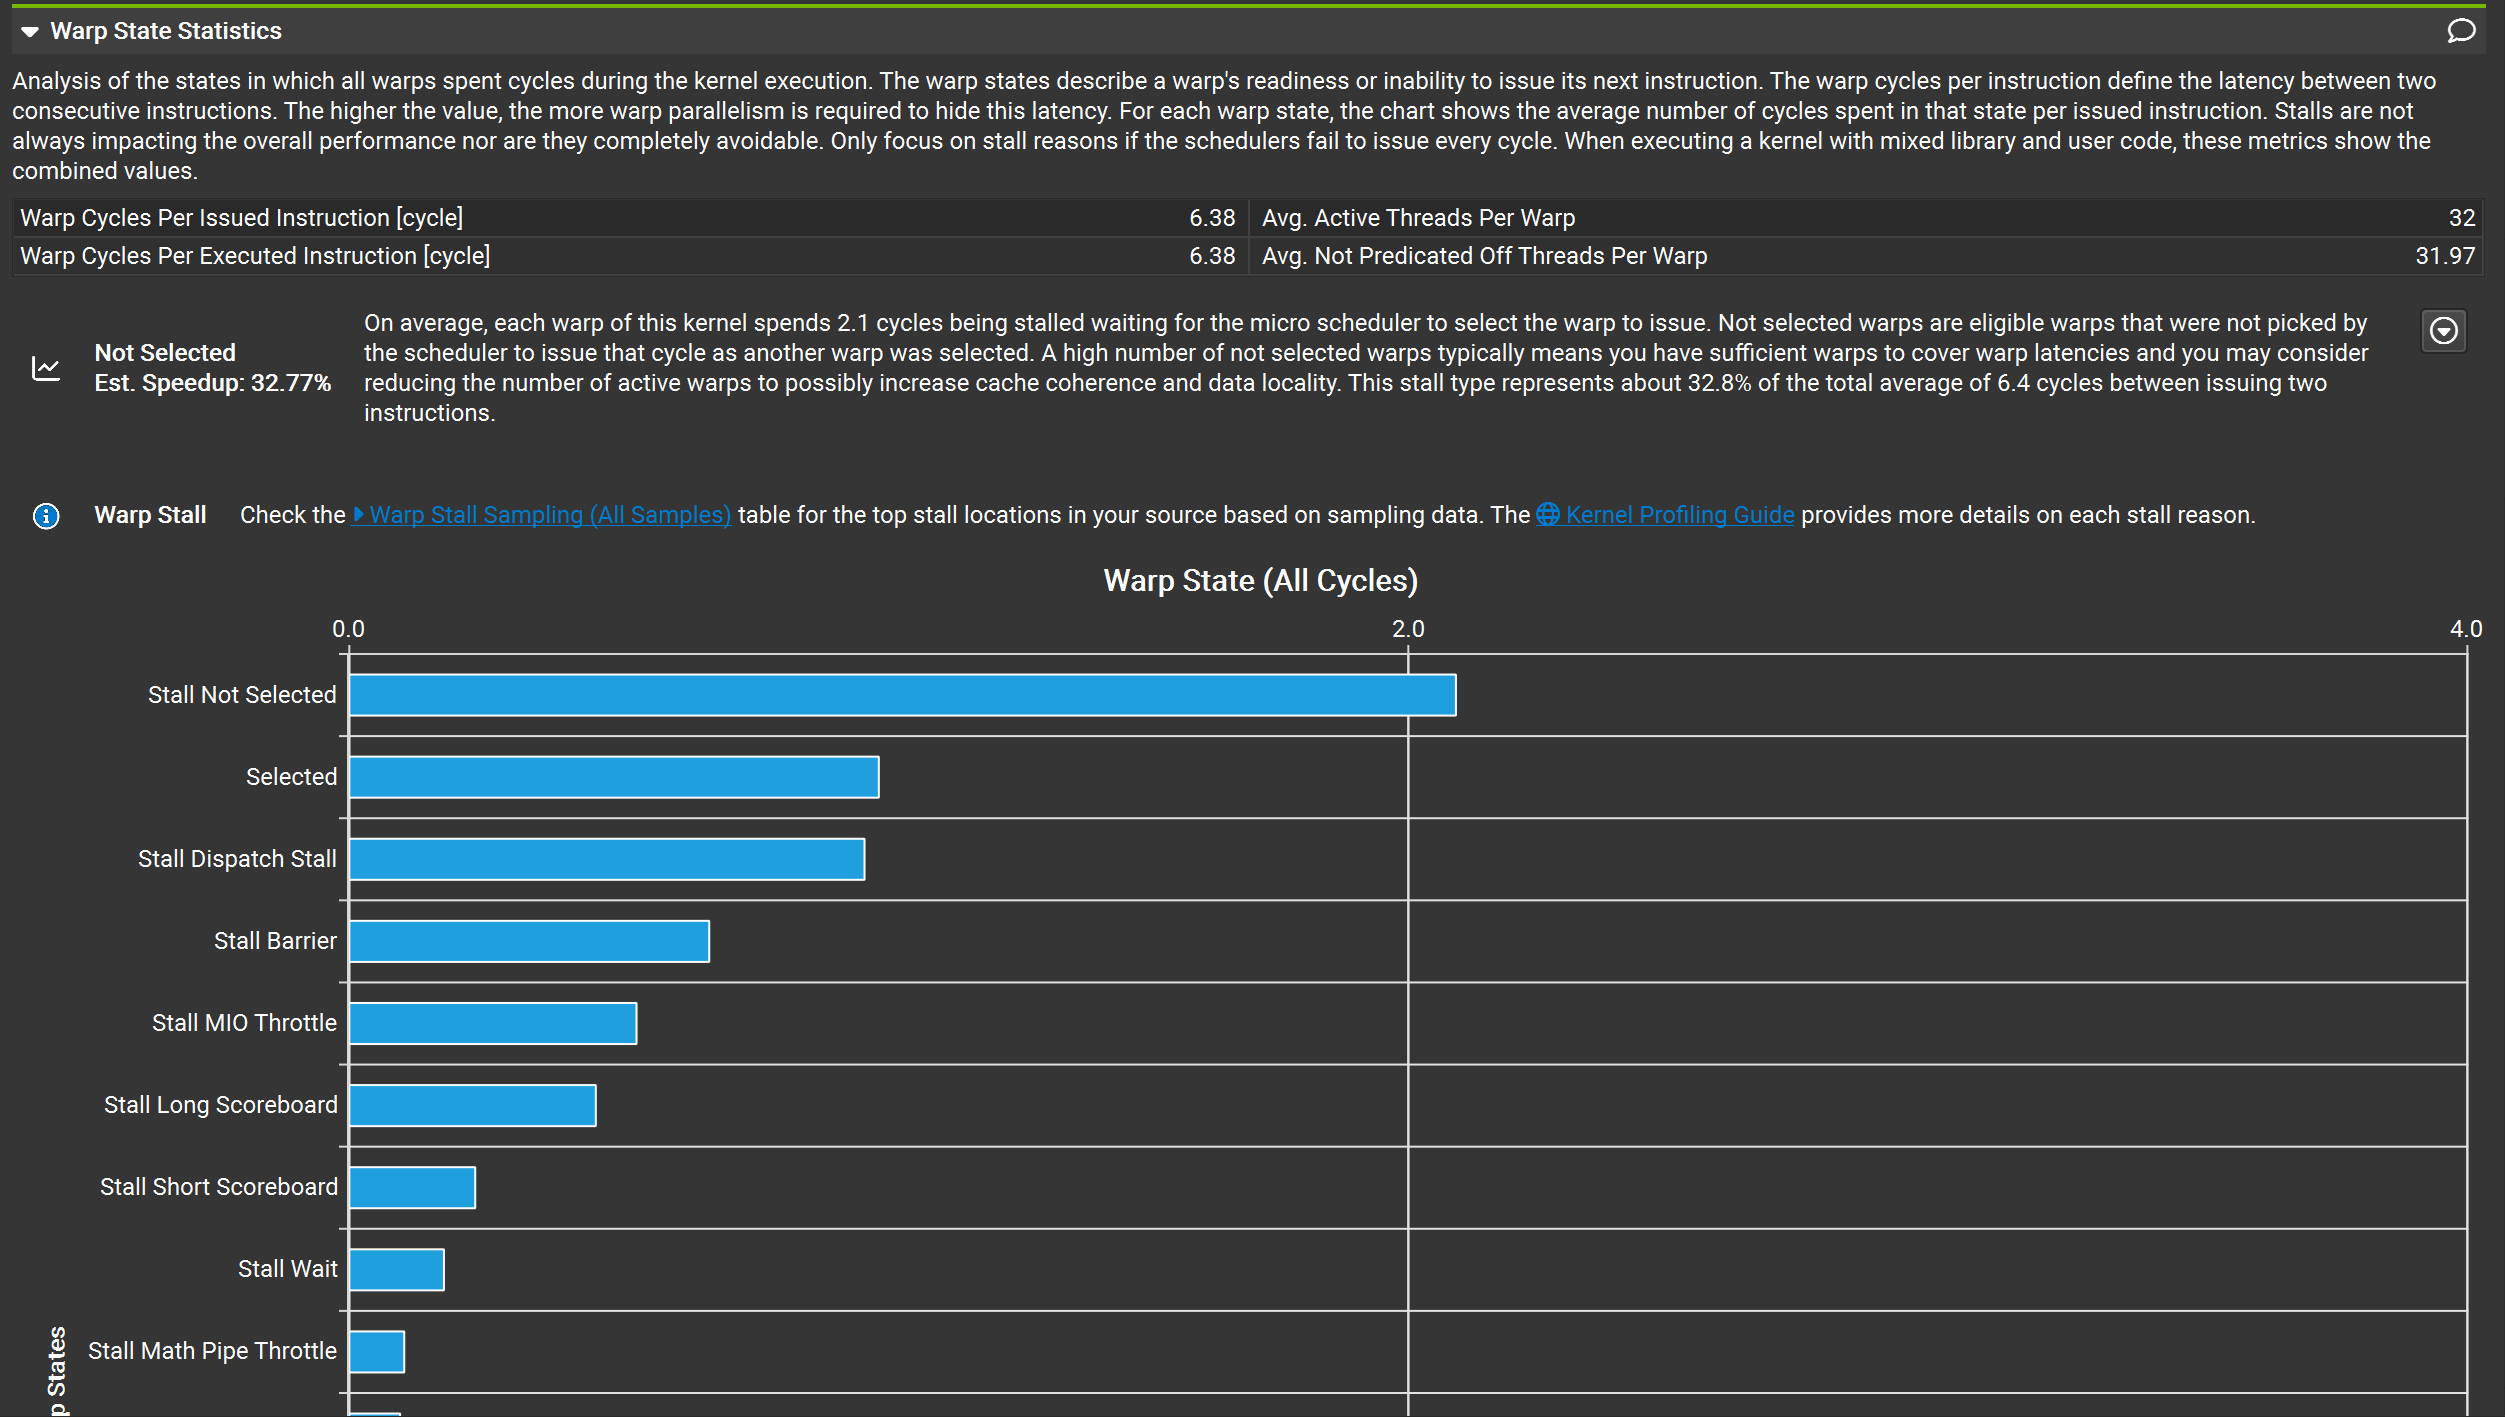
Scenario 1: If the proportion of “No Eligible Warp” is too high
This means the Scheduler cannot find any Warps ready to issue instructions, and the pipeline is starving. We need to try increasing the number of Active Warps:
- Check Theoretical Occupancy. If there is a large gap between it and the Device Limit, it indicates poor configuration of Block size, registers, or shared memory usage, which is limiting concurrency. (Reference: Execution Configuration)
- If Average Active Warps is significantly lower than Theoretical Occupancy, there might be Load Imbalance or Tail Effects.
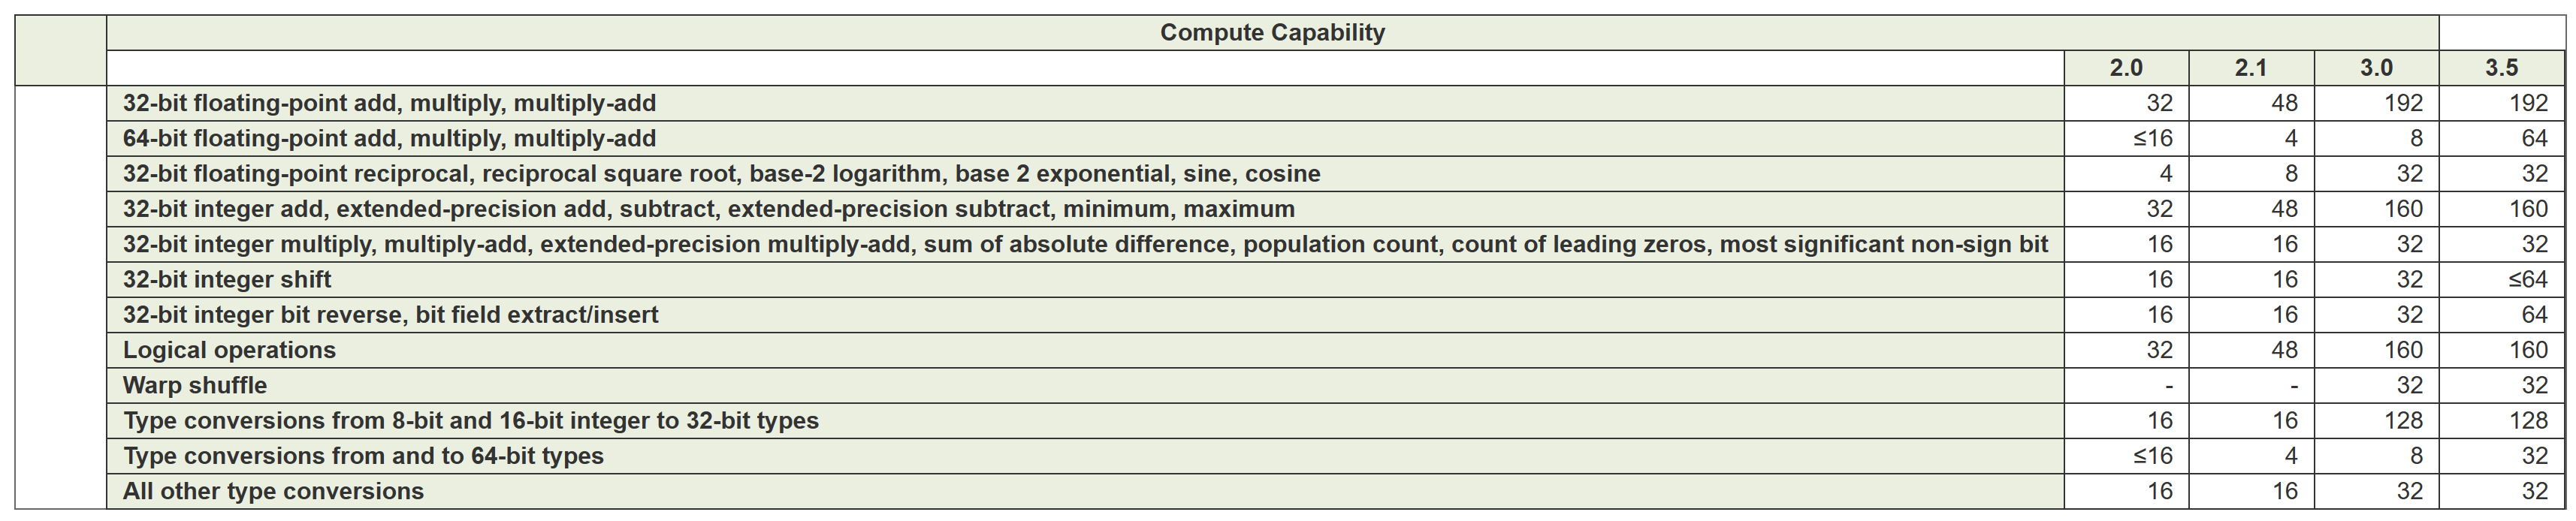
- Check Pipe Utilization. If the compute pipelines (like FMA units) are already fully loaded, increasing Occupancy won’t help. In this case, try reducing the instruction load or confirm if peak hardware performance has been reached. Different hardware architectures have different numbers of pipelines for various instructions, directly reflecting on instruction throughput performance (see official documentation: Arithmetic Instructions Throughput).
Scenario 2: If the proportion of “No Eligible Warp” is close to 0
This means the Scheduler always has instructions ready to issue.
- First, check if peak performance has been reached (either compute-bound or memory bandwidth-bound).
- If the average number of Eligible Warps is significantly greater than the number of Warp Schedulers per SM, an advanced optimization strategy is Instruction-Level Parallelism (ILP): merging the work of two or more threads into a single thread (Thread Coarsening). By reducing context switching and instruction overhead, the overall execution time might be shorter.
4.3 Comprehensive Analysis of Common Stall Reasons
When a Stall occurs, NCU provides a specific code. Here are the causes and solutions for core Stalls:
1. Memory and Cache-Related Stalls
lg_throttle: Excessive Local/Global memory operations. This could be due to uncoalesced memory access or Register Spilling causing data to be kicked out to slow Local Memory. Solution: Optimize memory access patterns; save registers.imc_miss: Immediate Constant Cache miss. Solution: Ensure threads within the same Warp access the same constant addresses.tex_throttle: Excessive Texture / Surface cache accesses. Solution: Consider moving some operations back to Global Memory.drain: Too much data written to memory at the end of a kernel, causing congestion. Solution: Coalesce Store operations.
2. Compute and Pipeline-Related Stalls
math_pipe_throttle: All Warps are simultaneously overusing a specific math function pipeline (e.g., FMA units are fully loaded). Solution: This is a “good” Stall, indicating compute is maxed out. If not maxed out, try increasing Active Warps to hide latency or mix different types of compute instructions.mio_throttle: Memory Input/Output (MIO) pipelines are overused. Usually caused by special math functions, branch instructions, or overly dense Shared Memory accesses.
3. Dependency and Synchronization-Related Stalls
short_scoreboard: Typically caused by short-latency data dependencies from Shared Memory operations (MIO operations outside L1EX) or MUFU (special function units). Solution: Try to use registers instead of Shared Memory.long_scoreboard: Long-latency data dependencies caused by Global/Local memory loads (L1EX cache). Solution: Find the instruction generating the data, increase Cache Hits, or use Shared Memory to prefetch data.membar: Waiting caused by memory synchronization instructions (like__syncthreads()). Solution: Reduce unnecessary Block-level synchronization.
4. Branch and Control Flow-Related Stalls
barrier/branch_resolving: Caused by Branch Divergence. Solution: Try to have threads within the same Warp execute the same workload to reduce conditional jumps.no_instructions: The Kernel is too small, resulting in no instructions to fetch, or jumps caused instruction cache misses. Solution: Optimize workload distribution and reduce unnecessary jumps.
(Note: If the task is too small, the workload is extremely imbalanced, or multiple programs are sharing the GPU simultaneously, some metrics collected by NCU (like Cache Hit Rate) may be inaccurate. Analyze with caution. Reference: Weird number for L2 cache hitrate)
In the next article, we will dive into the Methodology and Architecture Frontiers, exploring how to measure the ultimate compute and bandwidth limits of a GPU using Micro-benchmarks, and analyzing the revolutionary new features of PTX inline assembly and the Hopper architecture (H100).