TACO'22 | Performance and Power Prediction for Concurrent Execution on GPUs

Abstract
This paper shows that by using the execution statistics of standalone workloads and the fairness of execution when these workloads are executed with three representative microbenchmarks, we can get a reasonably accurate prediction. This is the first such work that does not rely on the features extracted from concurrent executions or GPU profiling data in the direction of performance and power prediction for concurrent applications. The proposed predictors achieve an accuracy of 91% and 96% in estimating the performance and power of executing two applications concurrently, respectively.
Background & Motivation
Any GPU server will have to deal with multiple concurrent applications. To effectively support this feature in an edge/cloud computing setting, some support for concurrency is required. Sadly, unlike multicore servers, GPUs were originally not designed for this purpose. There are several issues in concurrently executing applications on GPUs with any form of multiplexing:
- The TLBs that provide the address translation service are shared among the applications, and their limited size leads to frequent lushing of the context of other applications.
- This leads to TLB misses and hence increased latency.
- The concurrent applications cause interference in the GPU memory system due to interference in the L2 caches and beyond.
- Since the error reporting resources are shared among the concurrent applications, an exception raised by any one application causes all the applications to terminate.
- Scheduling many threads belonging to different applications adds to the overheads.
Most of the related work focuses on predicting the performance and power of standalone applications on GPUs based on the CPU and GPU performance counters, however none of them aim to predict the performance and power of the execution of concurrent applications on a GPU.
Contribution
In this work, the authors show that:
- It is possible to predict the performance of a bag-of-tasks on a GPU using simple metrics that are primarily collected on a multicore machine.
- It is possible to predict the power of a bag-of-tasks on a GPU using the metrics collected on a multicore machine and the power of the individual applications in the bag obtained on the GPU. They remove the reliance on the GPU performance counters unlike the related work in this domain.
- There are broadly three types of memory access behaviors in these workloads for any level of concurrency. Hence, instead of calculating fairness for every combination of workloads, the authors calculate three fairness values for each workload when running concurrently with three representative microbenchmarks. Hence, authors reduce a polynomial time problem to a linear time problem without sacrificing accuracy.
- The importance of features and the generalization of the proposed predictors.
Approaches & Experiments
This paper conducts some concurrent task experiments. Based on the experimental observations, we can gather the following insights:
❶ The performance and energy of executing multiple instances of an application on the GPU cannot be simply correlated with the corresponding performance and energy of the execution on the multicore processor.
❷ Contention in the shared resources plays an important role when multiple applications are launched in parallel.
❸ The performance and energy of such a concurrent execution on a GPU can be directly correlated with the performance and energy of the corresponding single instance execution on the GPU.
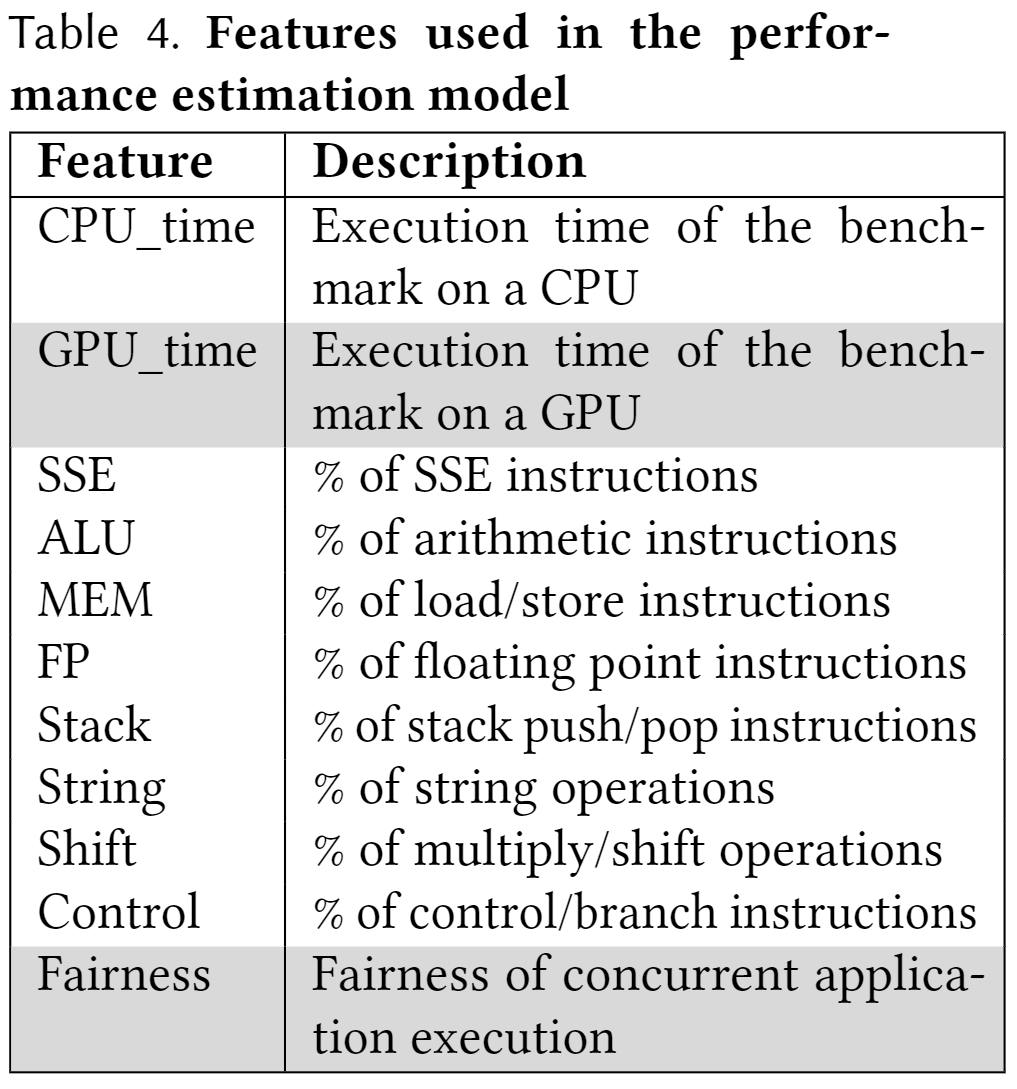
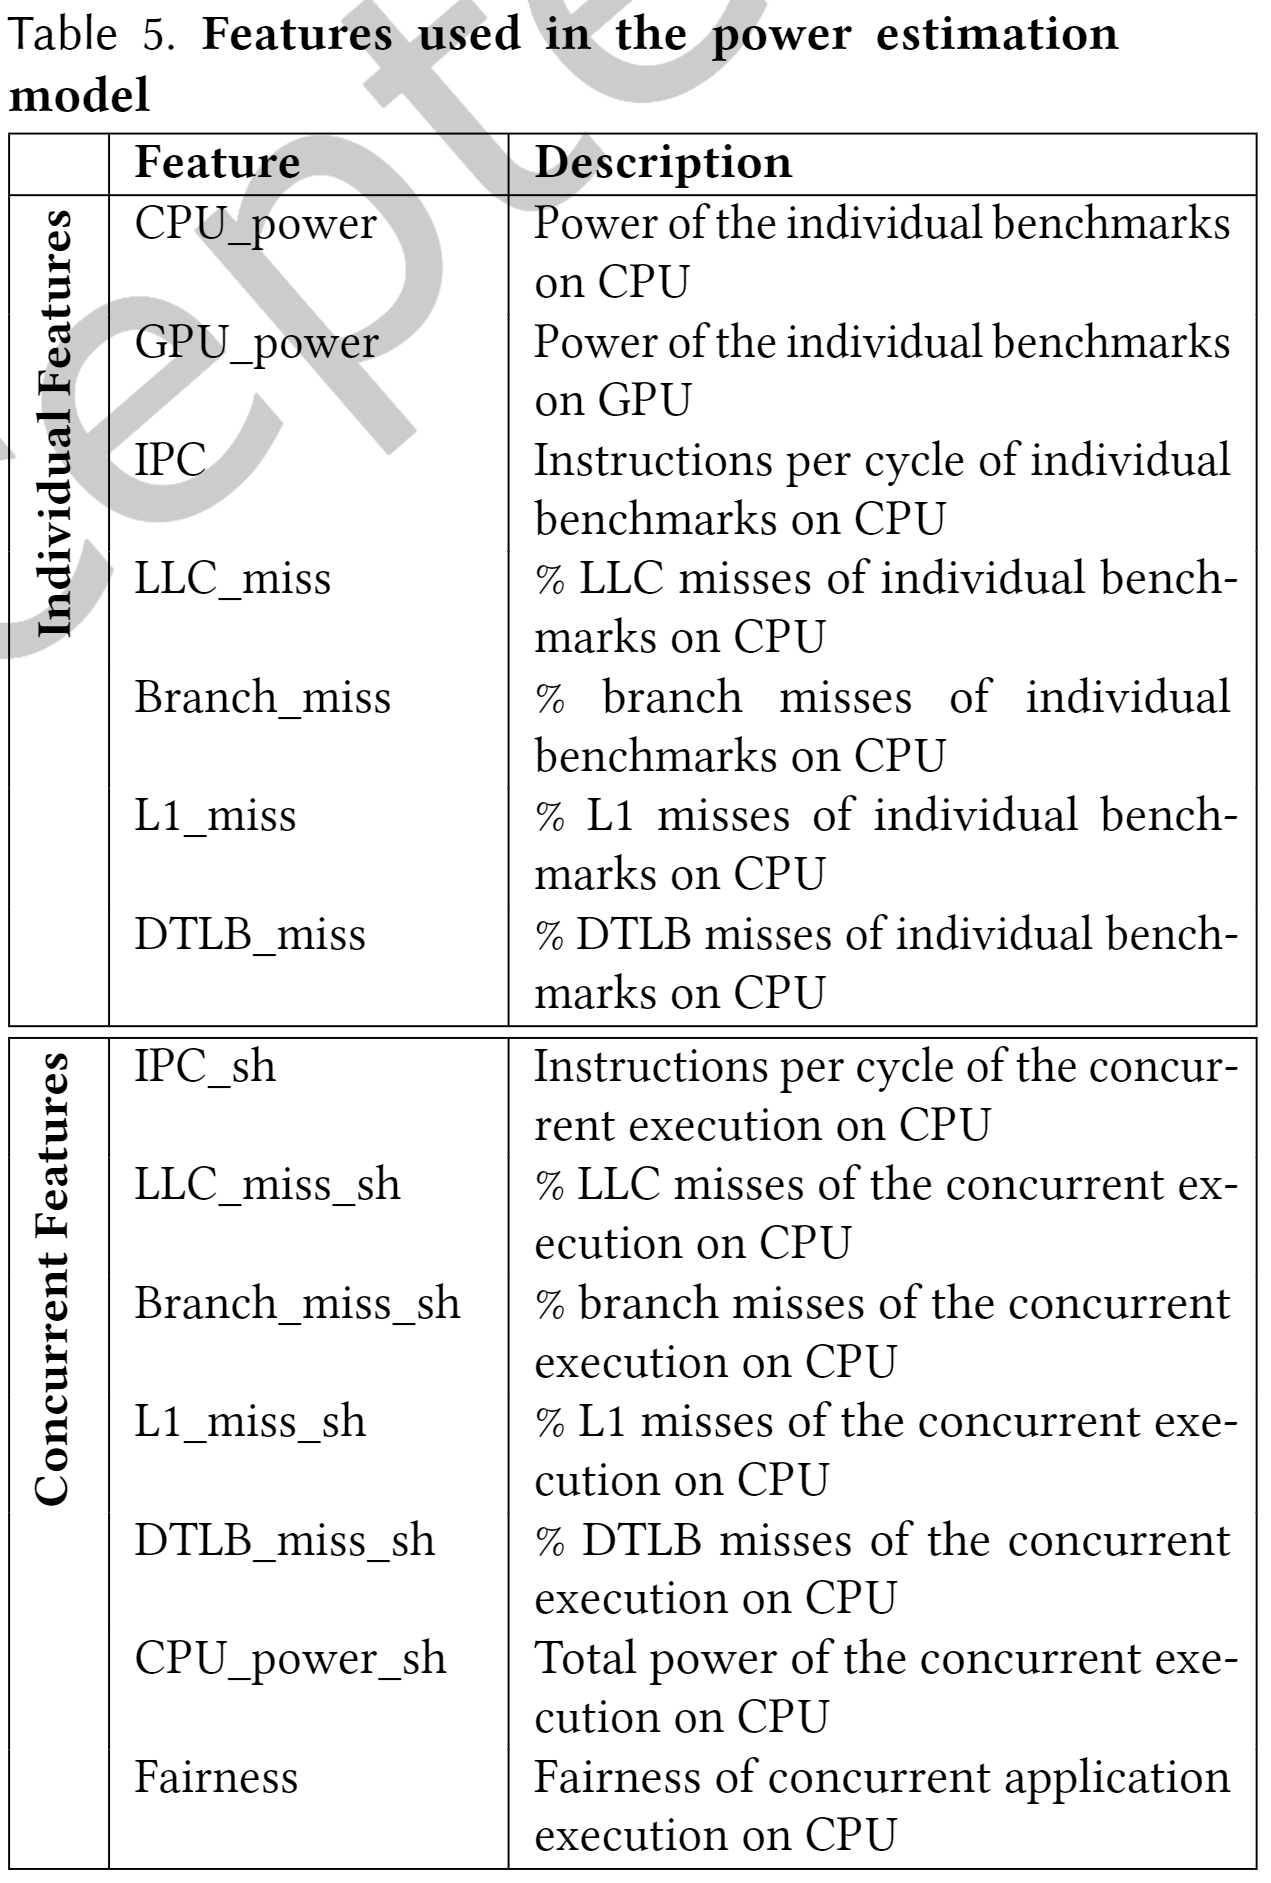
Based on Insights 1, this paper selects table 4 and table 5 as the performance prediction features and power prediction features, respectively.


The fairness is defined as one of the features because we are dealing with a multiapplication scenario. It quantiies the slowdown in an environment with resource contention. The equation for fairness, $fair_{\mathcal{F}}$, of a bag-of-tasks, $\mathcal{F}$, is given by: $fair_{\mathcal{F}}=\min \left(\frac{I P C_{k}^{\text {shared }}}{I P C_{k}^{\text {alone }}} / \frac{I P C_{l}^{\text {shared }}}{I P C_{l}^{\text {alone }}}\right)$, where $k$ and $l$ are tasks in the bag.
The way the fairness metric is defined is quite problematic ś it involves running all combinations of benchmarks on multicore CPUs, which has a prohibitive overhead.
To ameliorate the situation, the authors propose a new fairness metric. They first try to find a pattern in the behavior of these workloads and their combinations. They perform a clustering on a total of 530 combinations (called data points in ML jargon). They found that there are three clusters, and these clusters correspond to the memory behavior of the workload combinations.
Hence, the solution is that we can use three microbenchmarks named Low, Medium, and High based on the percentage of LLC misses that they witness. At the time of training the ML model, we choose a fairness value (out of the three fairness values) for each workload on the basis of the total LLC misses of the other workloads that are running concurrently with it. We add the total LLC misses of the rest of the workloads and then categorize the sum into three categories based on two threshold values. The categories are Low, Medium, and High. Then, based on the category, we choose a fairness value (collected in the offline, pre-processing phase). This is done for all the workloads that are running together. Thus, all the features are now obtained from either the execution of the standalone workloads or the concurrent execution of the workloads with three microbenchmarks.
In the performance and power prediction experiment, the authors tried different features (table 4 and table 5) combinations and then got insights 2 and insights 3, respectively.
❶ CPU_time has a positive effect on the prediction error when combined with the insmix (instruction mix) feature.
❷ Fairness improves the prediction error when used with a combination of CPU_time and insmix.
❸ Fairness, GPU_time and CPU_time reduce the prediction error. However, the extent of reduction is different depending on the already existing features in the feature vector.
❹ The positive effect of GPU_time on the prediction error is more pronounced as compared to the effect of CPU_time.
❶ Addition of GPU_power to any combination of concurrent features reduces the error by at least 2X suggesting that GPU_power has the maximum positive impact in reducing the prediction error.
❷ The percentages of L1_miss, Branch_miss, and DTLB_miss rates of standalone applications have a negligible effect on accuracy.
❸ The top two combinations in terms of accuracy are comb16 and comb20 (there are 20 combinations in total). The authors finally chose comb16 because it does not require any of the concurrent features. The final features are: GPU_power, fairness, CPU_power, and LLC_miss (see Table 5).
❹ The final models are DT, GB, RF, and SVR.